Curve and power profile in cycling
Curve and power profile in cycling
The power profile in cycling is a graphical representation of the average power values obtained by the athlete during certain periods of time making an effort.
By average power we understand the arithmetic mean of the power generated in a period of time and it will be obtained by dividing the watts of the entire session by the time spent. Normally it is a data that will automatically provide the potentiometer.
In general, certain certain or critical periods of time are used because they will provide information corresponding to different physical capacities that we will develop in another article, the most characteristic are:
Power in 5 seconds: indicates the capacity for maximum efforts or maximum anaerobic capacity.
Power in 1 minute: indicates the anaerobic capacity.
Power in 5 minutes: indicates the Maximum Aerobic Power (MAP) or maximum oxygen consumption (VO2max)
Power in 20 minutes: indicates the power in the vicinity of the anaerobic threshold
Power in 60 minutes: Also known as Functional Threshold Power or FTP. It is an indicator of the maximum power that we would be able to develop during a period of one hour.
Without going into describing the energy systems used by the body to supply energy to the muscles, we will limit ourselves to briefly describing some of the concepts mentioned:
Aerobic and anaerobic effort
We will call it an aerobic effort to that effort of prolonged duration in time and that is carried out at a moderate or low intensity and therefore sustainable. The circulatory system is capable of providing sufficient oxygen for energy-producing cellular chemical reactions.
On the other hand, an effort of an anaerobic nature is known as one that has a high intensity and that is carried out during a short period of time. Because this effort is very intense, the oxygen available to the cells is limited by exceeding the supply capacity of the circulatory system, so the energy production system in the cells will be different. These efforts will only be sustainable for short periods of time.
Maximum Oxygen Volume
VO2max is the "Maximum Oxygen Volume" and represents the maximum amount of oxygen in milliliters that a person consumes each minute and for each kilogram of body weight (ml/kg/min) and gives an idea of the efficiency with which our body uses the Oxigen. It is therefore a measure of our aerobic capacity and the resistance of our cardiovascular system. It is a value that has a great genetic dependency although its improvement is possible within certain limits.
Returning to the subject of the power curve, there is specific software for training that automatically provides this curve and there is also abundant literature about its interpretation, the methods for obtaining the data, etc. On this occasion we only want to expose what is the basis for the elaboration of the power profile in a manual and simple way so that you know its fundamentals.
It is necessary to point out that, in order to correctly compare the curves of different athletes, or your own over time, the correct thing would be to have the power data based on the individual's body weight since it is not the same to develop 300 watts weighing 50 kilos than developing 300 watts weighing 80 kilos, especially when it comes to ascents, in the case of the heaviest athlete, his ascent speed will be less for the same power developed. This power per kilo is obtained simply by dividing the absolute watts by the kilos of the athlete's weight.
Elaborating a cyclist's power profile
To create a power profile, it will be enough to obtain the average power developed in the different measurement time intervals.
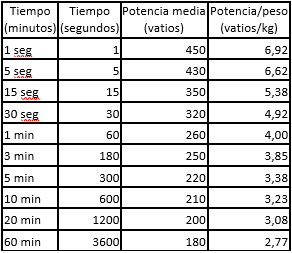
Example: We will create a table with the average power values obtained in the different time intervals.
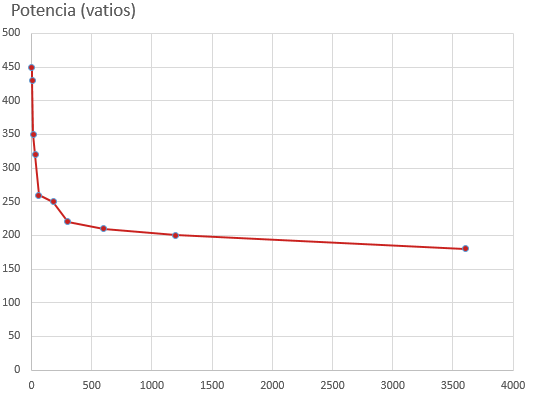
We will build the graph where on the x axis we will represent the time and on the y axis the power.
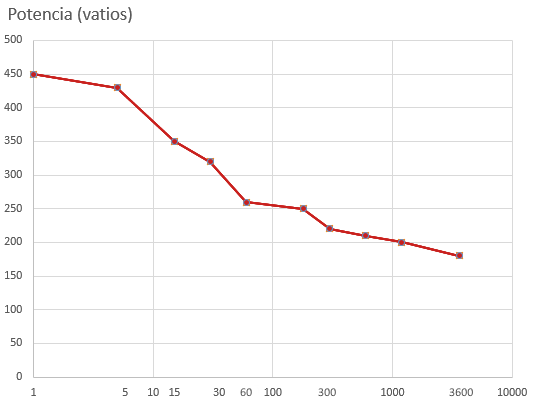
In order for the graph to show in a more detailed way the values for smaller time intervals, 1 second, 5 seconds... that are very stacked, it will be convenient to represent the x-axis on a logarithmic scale.
In another article we will make a more detailed analysis of the information provided by the power profile about the athlete's abilities and, above all, the areas where improvement is possible depending on their objectives.
Sicami Tracks - Début