Your Stats
Data analysis
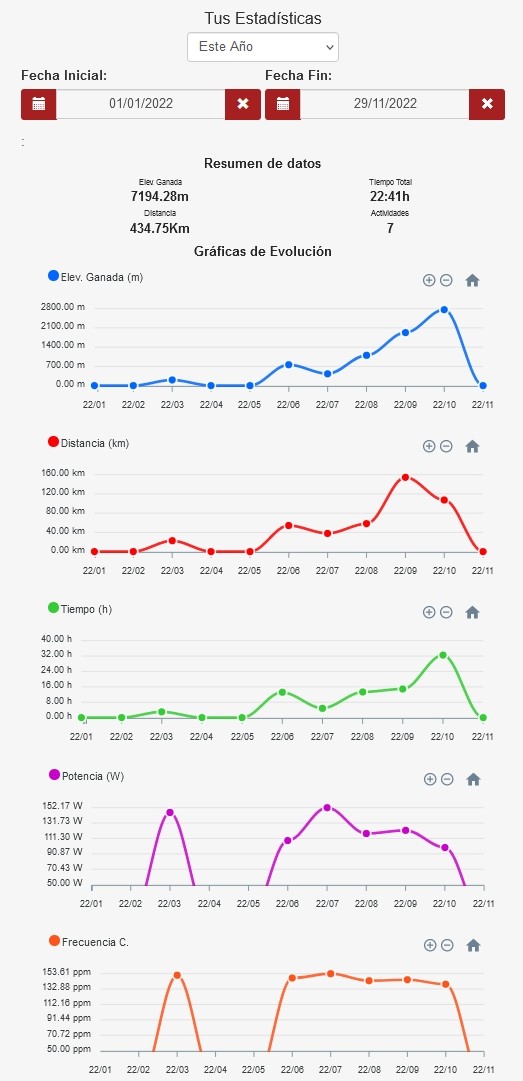
In this section, you can see the evolution of data that will help you understand the progress of your performance.
Information is displayed based on the time period you select. The graphs will help you quickly check your evolution.
In addition to selecting a period, you can also choose a start and end date to view the period of time you want to examine.
If you are one of those people who seek to improve every day, the statistics section will be very useful, since you will be able to see the evolution of your parameters, what type of training is working for you and what is not. You will be able to make decisions with valuable information so as not to make mistakes.
You can choose to view statistics for the following time periods:
- This Year , which will show you the data for the current year.
- Today , you will see the data of the current day.
- This week , you will see the data.
- Last week , you will see the data.
- This Month , you will see the data of the current month.
- Last month, you will see the data of the past month.
- Last three months , you will see the data of the last three months.
- Last six months , you will see the data of the last six months.
- Last Year , you will see the data of the past year.
- Last two years , you will see the data of the last two years.
- Last three years , you will see the data of the last three years.
You can also manually select a start date and an end date to choose the period for which you are interested in checking your activity.
Suggestions
Is there any interesting information for you that we are not offering you? Contact us to assess the possibility of adding it.
Click on the following link and start enjoying your statistics now.
Sicami Tracks - Home