Basic notions on map interpretation
Representation of geographic data in two dimensions, contour lines
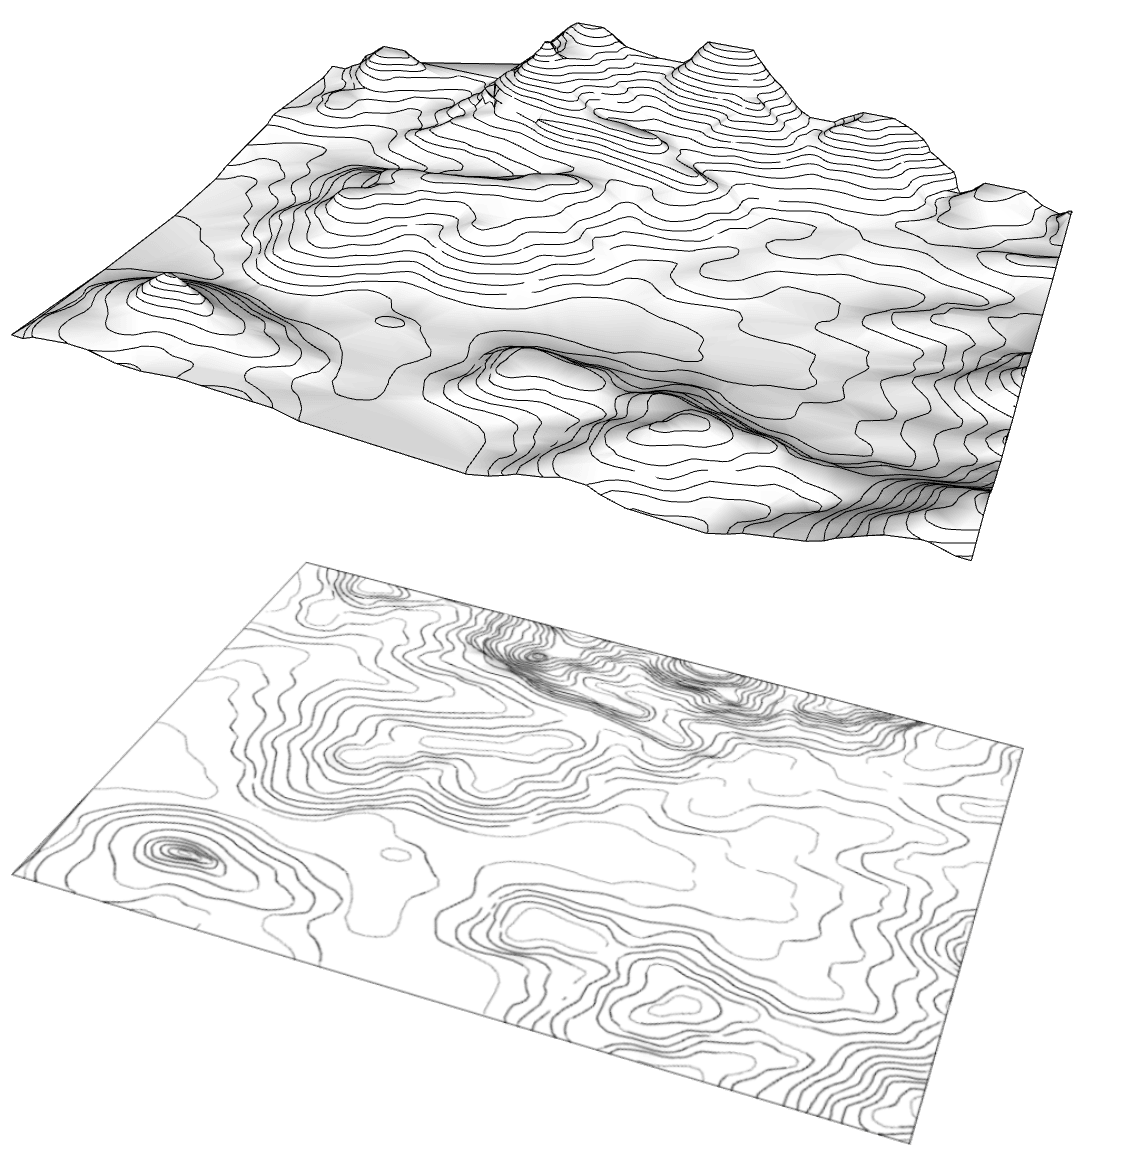
Isolines are used to represent the distribution of a variable (temperature, atmospheric pressure...) on a surface. The isolines are lines that join points with the same value on the surface, the value can be the one that is chosen, temperature (isotherms), pressure (isobars), precipitation (isohyets).
The isolines that join points of equal altitude of the terrain are known as "contour lines" and allow the representation of the terrain surface in two dimensions.
Types of contour lines
On cartographic maps we will find two or three types of contour lines represented, normally in brown.
Contour lines
Are the thinner lines.
Master contour lines
Are thicker lines.
Auxiliary contour lines
Are thinner Dashed Lines
Additional numerical information
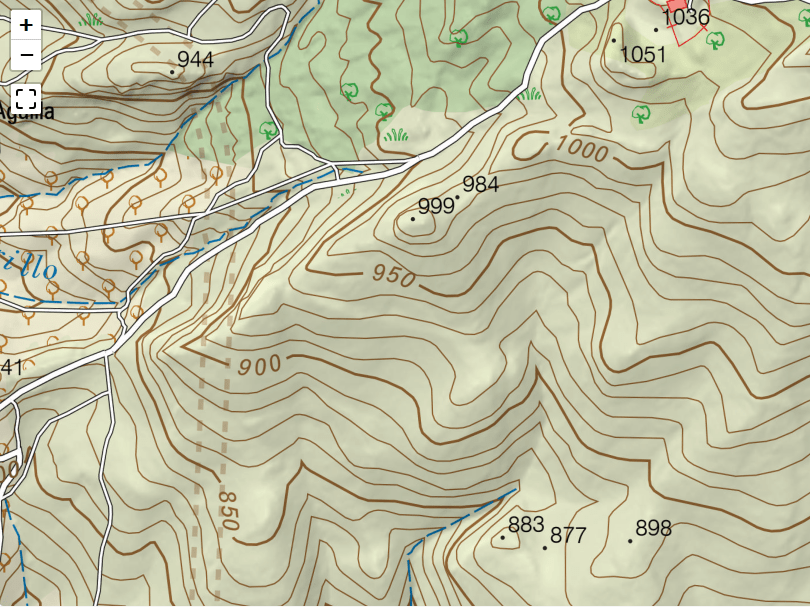
Master curves display a number that represents the absolute value of altitude along that line. The numbers are oriented so that the top of the number indicates which way the altitude value increases.
If between two master lines, for example 900 and 950, we find four level curves, these will divide the space into 5 parts and we will interpret them as the intermediate values between 900 and 950, that is: 910, 920, 930 and 940.
If a master line does not have an indication with a number, probably due to lack of space in the visualization, we will interpret that it follows the same interval as for the rest of the master lines.
The summits or tops are the points of the terrain of maximum relative altitude and are also shown on the map. In the following example we can see that there are several summits (indicated by a dot and numbers in black) of 999, 984, 883, 887, 1051... meters.
More information
The gradient
The gradient or degree of variation of the altitude is always perpendicular to the contour. When the lines are very close to each other, they indicate that the altitude variation is very fast, which means that the altitude increases or decreases sharply.
The distance between contour lines will depend on the scale of the map and is usually between 50 and 100 meters for the main lines and between 10 and 20 meters for the intermediate (thinner) lines.
The scale
the scale of a map indicates the equivalence between the real distance and the distance represented on the map. For example, a scale of 1:10,000 means that one meter on the map equals 10,000 meters in reality, or that one centimeter on the map equals 10,000 centimeters in reality. Larger scales will cover more of the terrain but the detail will be less.
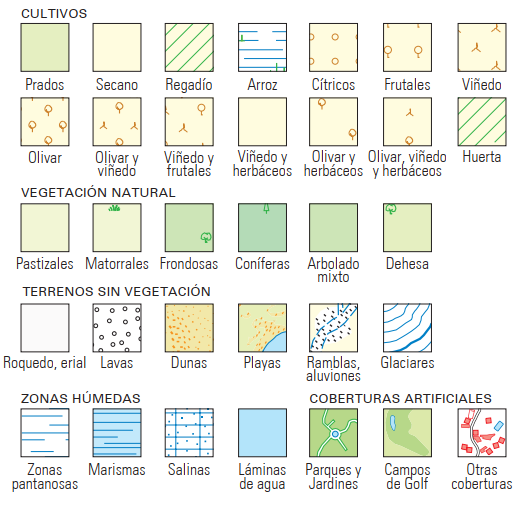
The legend
If the map has a legend or documentation of the symbols used, it is convenient to review it as it will provide us with a lot of information about the units of measurement used, the colors, orientation, scale and elements represented.
In the map of the previous image we can see that there are some non-permanent streams or rivers marked with a broken blue line.

also an olive grove on the left bank, below (at a lower altitude) a leafy area and scrub areas.


Sicami Tracks - Inizio