Tutti Gli Articoli
News and Updates from Sicami Tracks
Questions, suggestions and bug reports can be sent to us by e-mail: info@sicami.com and Telegram https://t.me/SicamiTracks
29/12/2024
- Added the ability to import/load TCX files.
26/09/2024
- Added new type of activity "Gravel", both in Sicami and Oruxmaps.
28/06/2024
- Corrections in Waypoints editing.
19/06/2024
- The real-time map is prepared to receive more information from Oruxmpas. When you click on the person's icon, we will see values such as speed, phone coverage, battery level, etc., as well as a message that that person can write from their mobile phone. . This feature is currently only available in Beta versions of Oruxmaps dated after 06/18/2024.
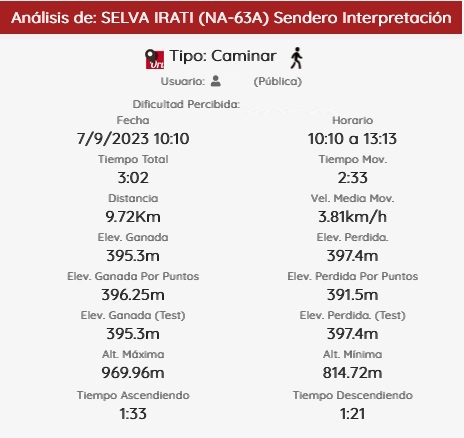
- Change in the way of calculating ascending and descending time visible in the Route Analysis.
25/05/2024
- From this moment on, the default real-time map shows the route followed by the people/friends who are sharing their location with us.
- Correction of various minor errors.
03/03/2024
- In the user profile options "Modify my data", tab "Sport" you can now adjust the power percentage for the estimated cycling times. For the same purpose it is also possible to set a reference speed for each user for walking routes.
- You can also specify the heart rate zones, so that you can see the new heart rate zone graph in "Detailed activity analysis".
- Fixed possible error when reversing the direction of routes from the Route Designer.
10/02/2024
- Added the option to see the estimated duration of a route (right now only available for bicycles)
10/01/2024
- Added route map option to search by area name, city, etc.
- This search option has also been added to the track display screen, accessed by pressing the More button
- Changes in Catalog display.
- Internal changes for SEO purposes.
17/10/2023
- From today the waypoints of route indications from Oruxmaps are shown in Sicami.
- Also a possible problem has been solved, when sending a route to Oruxmaps these waypoints of route indications were not being shown.
29/09/2023
- With the intention of showing a higher quality content, from today, in the screen to see Public Activities and Plans, when you enter, the activities or plans that do not have an image or description will not be shown. To see everything as before you can click on the Search button and uncheck the box we have added for this function.
- This means that if you want the activities or plans you set as public to be easily viewed by others you will need to add a description or image.
- In addition to the above, only activities and plans from the user's country will be displayed by default. There is also the option to deactivate this filter in the search screen.
- Soon we will add the option to enter manually the country of each user from "Modify my Data", right now the country is the one configured in Oruxmaps.
- Changes in the display screen when entering Sicami from Oruxmaps.
21/09/2023
- Changes in the search screen when accessing from Oruxmaps.
- There is now a single Route Map, and once inside the screen you can select whether to view all routes or only your own routes.
18/09/2023
- Improvements in the photo gallery of the routes: Possibility to rotate images, swipe with your finger on mobile phones, zoom with two fingers, etc.
- Small tweaks in route planner.
- Slight improvements in synchronisation with Oruxmaps.
- Users who have had a public route published in the last month and a half are shown less advertising.
23/08/2023
- First approach to allow selection of map type / style in 3D view
14/08/2023
- Correction of minor errors
04/08/2023
- Changes in visual appearance
- Correction of minor errors
11/07/2023
- Some improvements in the Route Map
08/07/2023
- From today, Tags are now called Catalogues and have more relevance in Sicami.
- We now have the possibility to add our own and others' routes to a Catalogue.
- We have also added the option to show the avatar you have in Oruxmaps in Sicami. In addition to being able to change that avatar from Sicami.
- There are more changes to the Route Planner.
- Some minor errors are corrected.
30/06/2023
- Following our philosophy of continuous improvement we have improved the method of ramp detection and the resolution of the calculation curves to obtain better values of our GRSic difficulty index, from today the values may vary slightly as some weight is subtracted from the acmululated fatigue due to the slope overcome.
- Since yesterday, the plans can be given a planned date of completion.
22/05/2023
- Possibility that when uploading photographs if they have date and time coincident with those of the route that waypoints are added in the GPS position in which it was at the date and time of the photograph. This is only done if the photograph does NOT have GPS position and if it has a correct date and time.
21/05/2023
- At the end of the 3D view playback, the photos that were not displayed during the route are shown.
- Possibility to change the elevations of the route for those obtained from DEM files.
18/05/2023
- From today when photos are manually uploaded to a route from Sicami, if these photos are georeferenced (have gps position) a waypoint will be created in that route automatically, there is an option (checkbox) so that this is not done, but by default it is active that the waypoint is created
16/05/2023
- The perceived difficulty is shown in the track list and in the track view, which is the difficulty that the user who owns the route has manually selected "Perceived Difficulty".
- In the 3D view the waypoint pictures are shown framed within the 3D figure of the waypoint.
- The image also shows the text of the Waypoint name
28/04/2023
- Changes to the list of activities and plans screen, now showing an image with a map and the route. Other aesthetic changes have been made to this screen.
- When we are viewing an activity or plan, now the description is displayed below the entire screen, this is so that when there are long descriptions can be read more clearly, also by scrolling down, if the description is large enough, the map will be hidden to leave the entire screen to show the description.
21/04/2023
- Changes are made to the 3D animated view of routes to make them more fluid.
17/04/2023
- Translations into more languages are being added, so if you spot any errors and report them to us, we will correct the translation accordingly.
- Added the possibility to click on a user to see all the public routes that user has.
15/04/2023
- In the search conditions a checkbox is added to show only routes containing a description.
- In the search conditions a checkbox is added to show only routes containing images.
13/04/2023
- Added to the Statistics section the highlighted routes in the period, with more distance, elevation gain, longer duration, etc.
08/04/2023
- Added weather information for activities, you can see the weather conditions from the start time of the activity to the end time (hour by hour).
- Added weather information for plans, you can view weather conditions from the current date to the next 10 days, and within each day you can select any time (hour by hour).
- More variety of kmz / kml files supported for uploading.
- SICAMI map URL compatible with being able to create a geointent to share position from OruxMaps with SICAMI and see the nearest routes around me without having to search from the web. https://sicami.com/actividades/todas?lat={lat}&lon={lon}
- 3D view starts paused, you need to press play to start it.
- Multiple 3D view, with which you can make comparisons of several routes taken by different people on the same route or by the same person but at different times.
- Option to massively modifying the properties of the activities or plans has been added.
04/04/2023
- Pantalla de Análisis detallado de la ruta, a esta pantalla se accede desde la pantalla de visualización de cada ruta, se muestra entre otra información un perfil sectoriizado de las pendientes de la ruta, índice de dificultad GRSic de la ruta, información de potencia para deportes sobre ruedas, etc.
17/03/2023
-
- Initial page of Sicami is again the presentation of Sicami and not the activities, we undo the change that we made in previous versions because it was affecting us in the indexing of search engines such as Google.
- We added a mini html editor for the descriptions of the activities and plans. This way you can give some formatting to the descriptions and add links to external images.
- We added the possibility to see, modify and filter by "Difficulty" of the activity / plan.
- When entering the map in real time and creating a new route, the navigator will request authorization to "focus" the map on the GPS position returned by the navigator.
- Improvements in search filters.
- Other minor changes.
06/03/2023
-
- From now on in the 3D animated view you can change the zoom, position and angle without needing to pause the animation.
03/03/2023
-
- Now there is the possibility of uploading files and seeing that they only have Waypoints
- We clarify that in relation to Waypoints we still have a lot to do, for example being able to add a Waypoint from Sicami at a point that is not part of the route.
02/03/2023
-
- The Activities section becomes the home page of Sicami. Content that was previously on the home page can be viewed in the main menu "About Sicami"
- The upload of KMZ and KML files is allowed, due to the wide variety of possible formats in the KMZ and KML files, please notify us of any incident.
- Added the ability to specify the start and end meters for each activity. If it is not specified, the values established in "Modify my Data" will be taken.
- The image display part of the activities or routes has been retouched.
- The possibility of being able to see from Google Maps the indications to reach the point of the route that is specified has been added. This is done in the following way: when we are viewing an activity or plan, we click on the Tools button, then, on the menu item that is displayed "How to get there" and immediately afterwards we will click on the point of the route we want See directions on Google Maps.
- Other minor changes.
16/02/2023
- The automatic download time of Strava activities is uploaded to a check every 30 minutes.
- Usernames cannot match the names of other users.
- Some improvement on the 3D map.
14/02/2023
- As of this morning, every 10 minutes, information on the city, province, etc., where the start of said route is located, is added to the routes that did not already have it.
- This information from the previous point is valid to search for routes with the search engine, now the search is done by two criteria: the routes that are within a 50KM radius of the coordinates that the geolocation service that we use gives to the name of the zone written in the "Zone..." box, in addition to that, all the routes will be searched in which the written text coincides with any of the cities, provinces, etc. assigned as indicated in the previous point. This is done in both cases when you write something in the "Zone (50km Radius)" box.
12/02/2023
- The 3D view is now also available in Plans and in Activities that do not have a timestamp. The reproduction time is susceptible to improvement, which on some routes of not much distance may be excessive.
- The option in the 3D view to stop the execution of the playback and go to the beginning has been added.
- A new button has been added to show possible playback options for the route, for now there is only the option to stop the automatic 360º rotation.
- We reactivate the automatic import from Strava, we remind you that you have a box in Modify My Data
04/02/2023
- The request limits imposed by Strava for the import of tracks mean that for now we are forced to deactivate the "Auto-import tracks from Strava" option. We have verified that the limitation of requests that a priori should be for each user, when requests are made in an automatic process from Sicami add up and the limit is reached too soon, harming even those who do not activate this option and want to import from Strava manually .
03/02/2023
- Added the option to download Strava activities automatically. This option is activated from the user options "Modify my data", there we will have a new box called "Auto-import Strava tracls". When doing this, all the routes that each user has in Strava will be downloaded, be aware that they will have the same privacy that they have in Strava (private, friends or public).
The process is slow because Strava limits the number of requests every X time, so we make download requests every 10 minutes, this means that for someone who has a lot of activities on Strava it could take even more than a day.
On the other hand, we may later have to deactivate that option if we have any complaints from Strava, in the event that they consider us their competition. - By default, when a route is seen by its owner, it is shown completely, but when it is seen by someone who is not the owner, the first 400m and the final 400m are hidden.
This has always been the case, now we add the possibility that each user can specify the number of initial and final meters to hide. Later on we will also give the possibility that these initial and final meters can be specified for each route. - The hidden parts of the previous point when the route is seen by its owner are shown in gray.
- In the Map in Real Time we add a new box to the right of each "friend" to show or not the route that person has followed. The position and route followed will be shown only from the last 6 hours.
- The possibility has been added from the search for activities and plans to search for routes that are within a 50km radius of the written area (towns for example).
How to connect, link or integrate Oruxmaps with Sicami or Strava to automatically transfer or export tracks and routes. Step-by-step guide with screenshots.

This procedure will affect every recorded route, but not the already existing ones, which have to be transferred manually. This last manual method will be explained further at the end of this article.
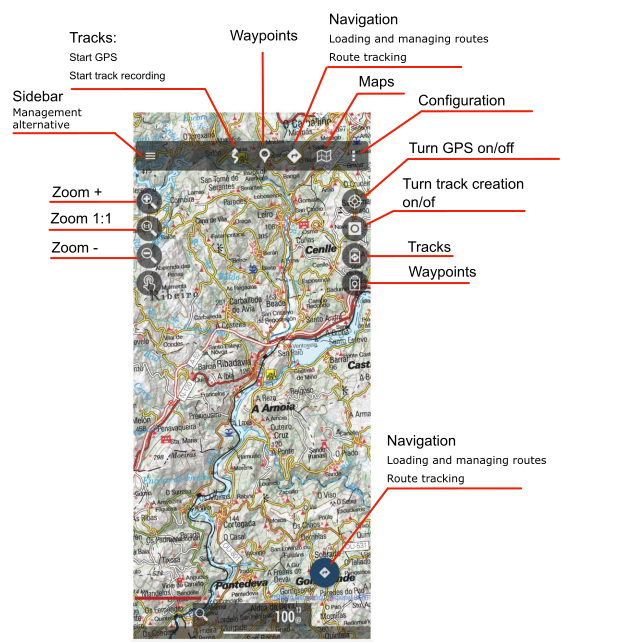
Scheme of the main screen of Oruxmaps with the most remarkable elements.
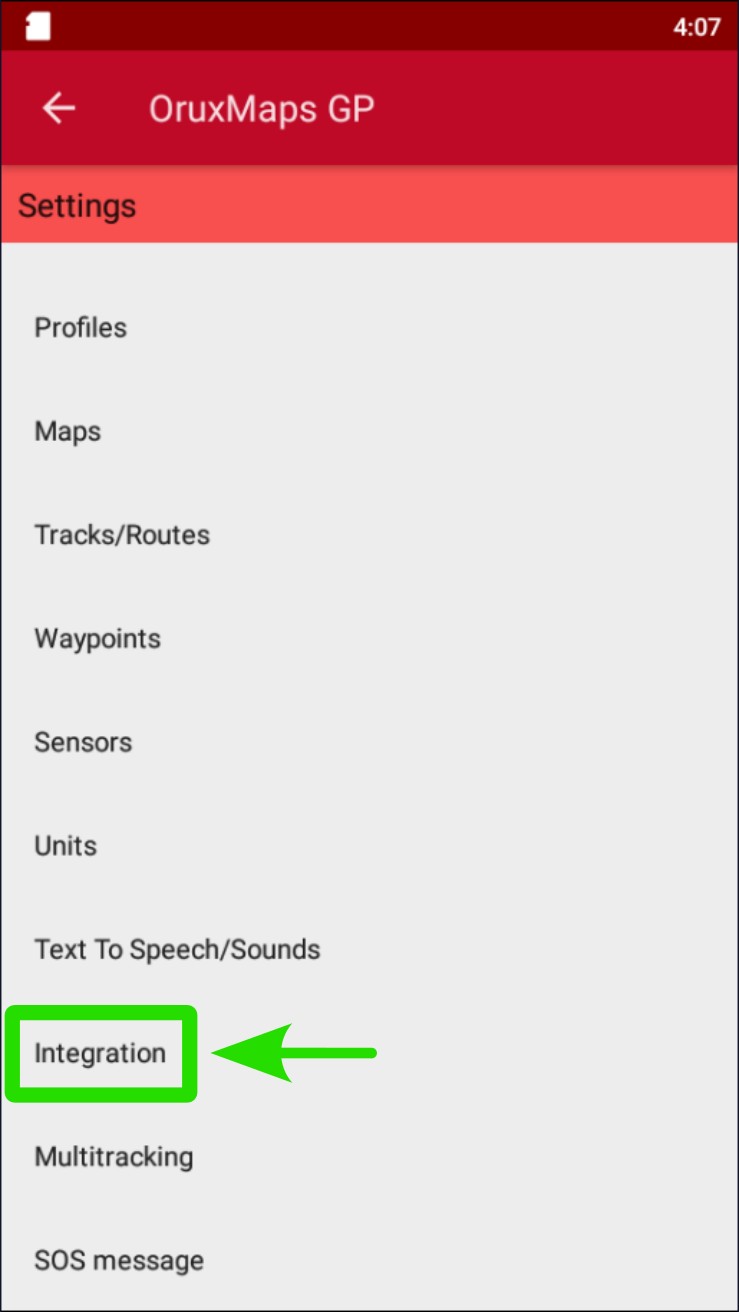
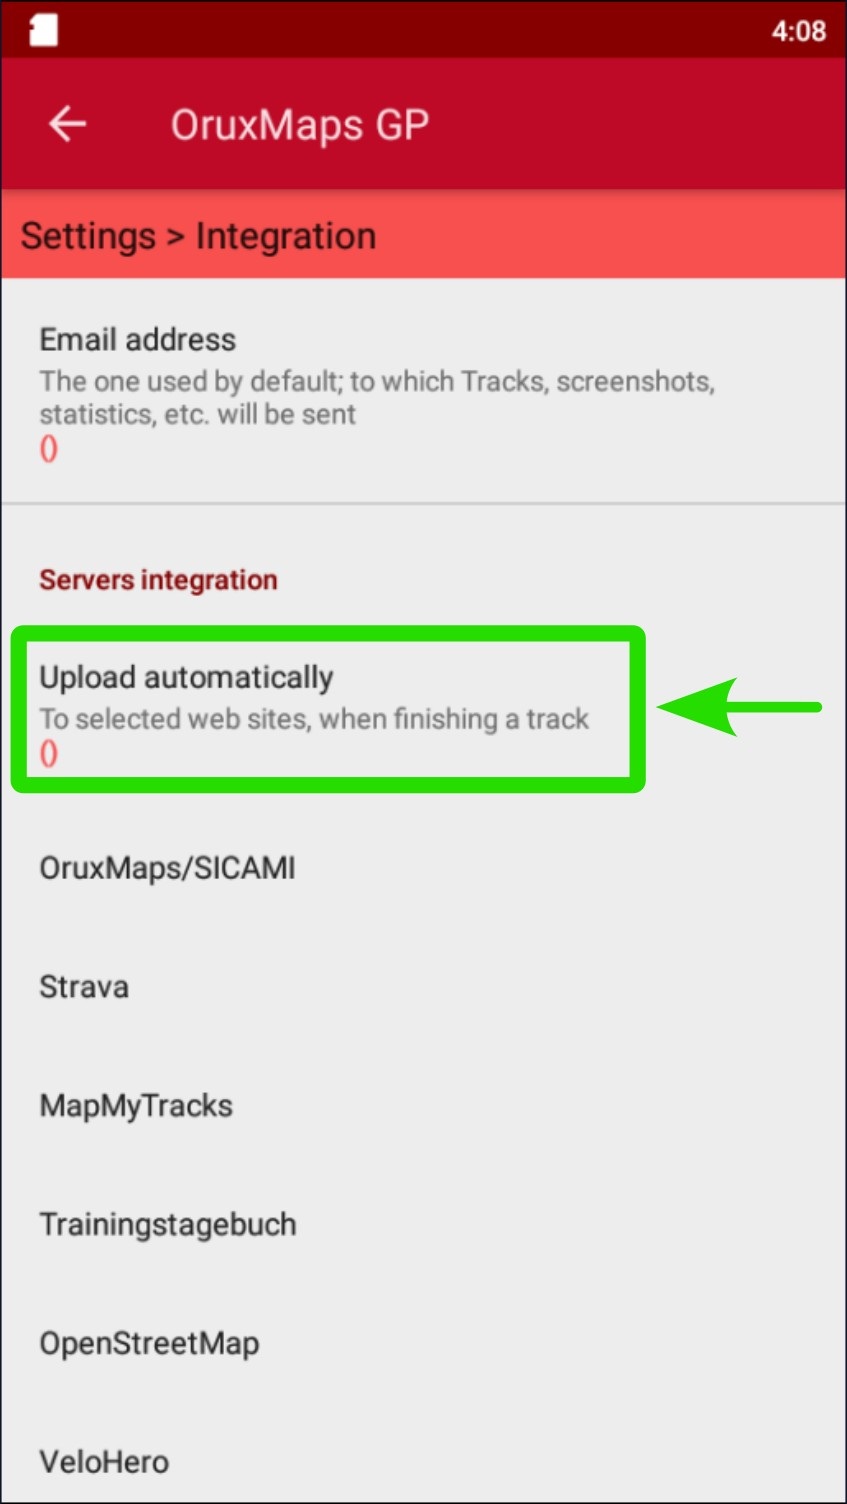
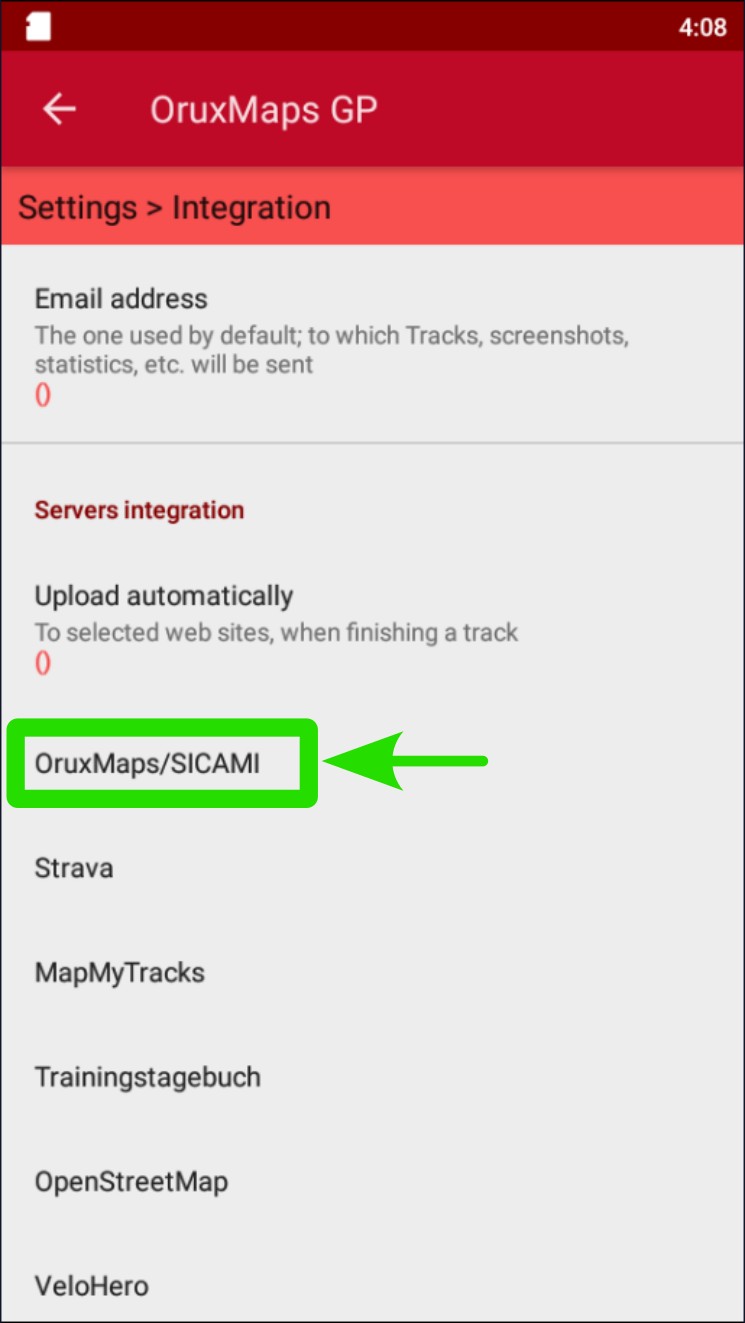
Go to Settings → Integration → Upload automatically → Check box Oruxmaps/SICAMI
It’s indispensable to have the corresponding accounts, otherwise either the information will be requested or it will be indicated so through a message.
The step-by-step procedure would be as it follows:
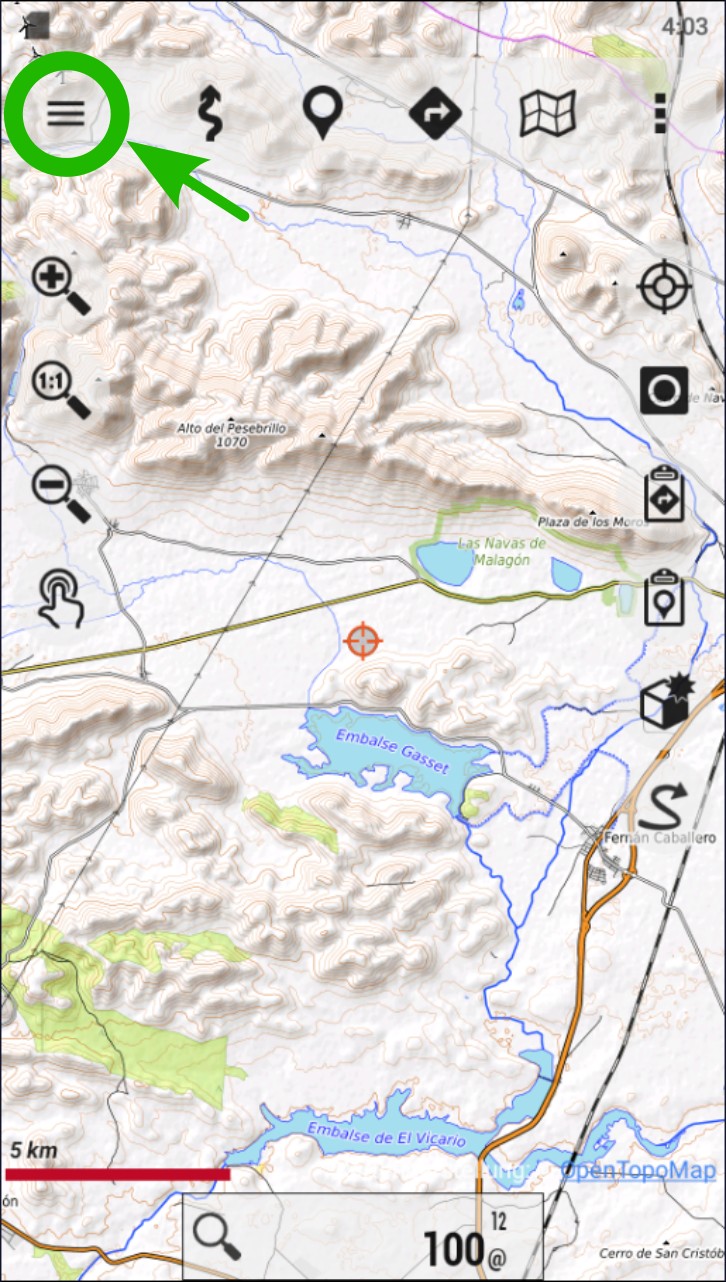
Tap on the “Sidebar” icon (three horizontal lines at the top left corner of the screen). This option is also accessible from “Configure the app” (icon with three dots at the top right corner of the screen.)
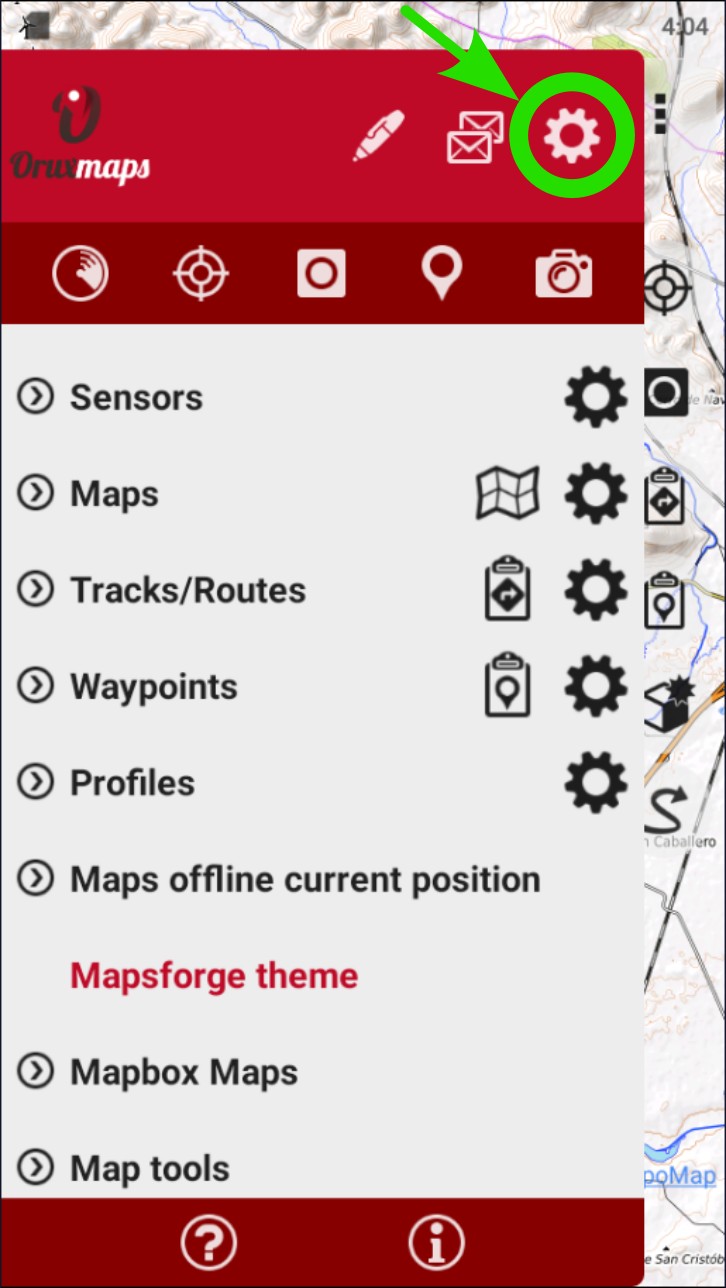
Go to “Global settings” tapping on the gear icon.
Scroll down until you find ‘Integration’. Whether all the options are visible or not will depend on the screen resolution of the phone.
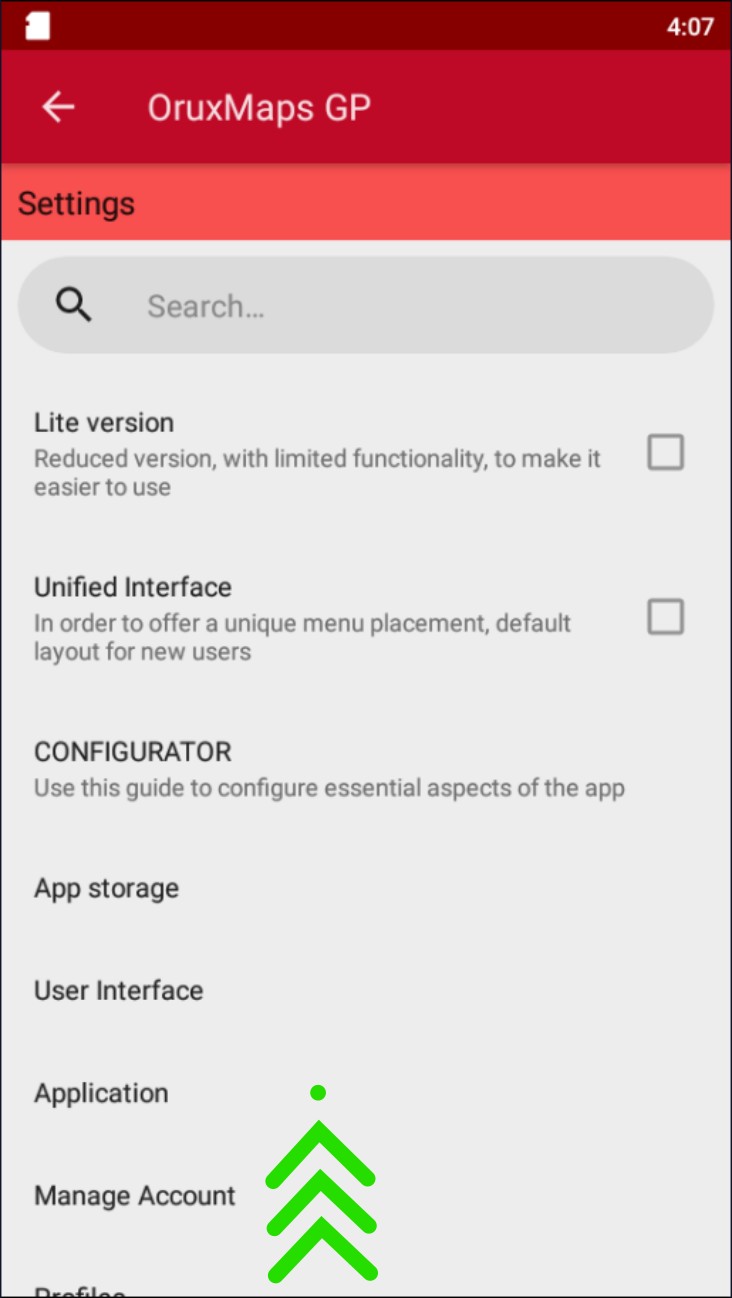
Tap on "Integration".
Tap on "Upload automatically".
Check the corresponding box for the app you want to link.
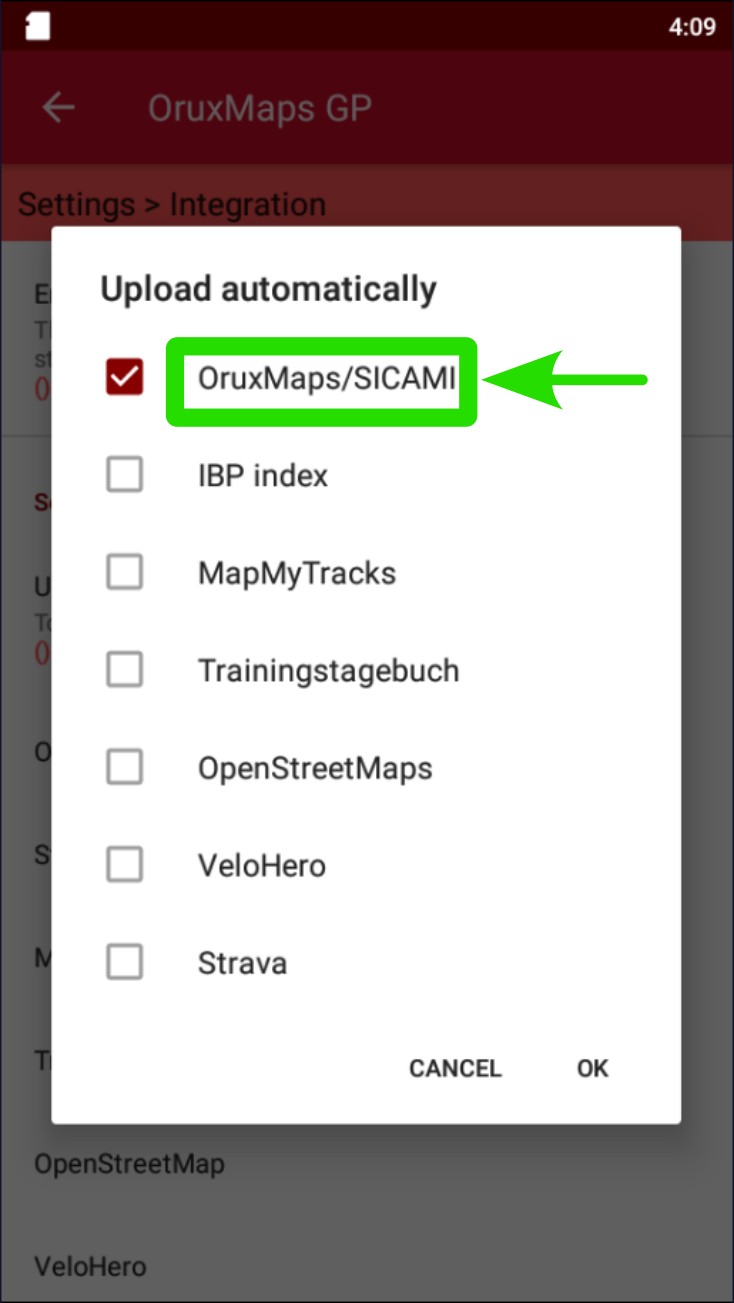
In case the account isn’t configured, the corresponding information for the account on SICAMI will be requested. For Strava, you will need to log in through the pop-up window.
Configure the privacy of automatically-uploaded routes and whether you want the related pictures to be uploaded along them.
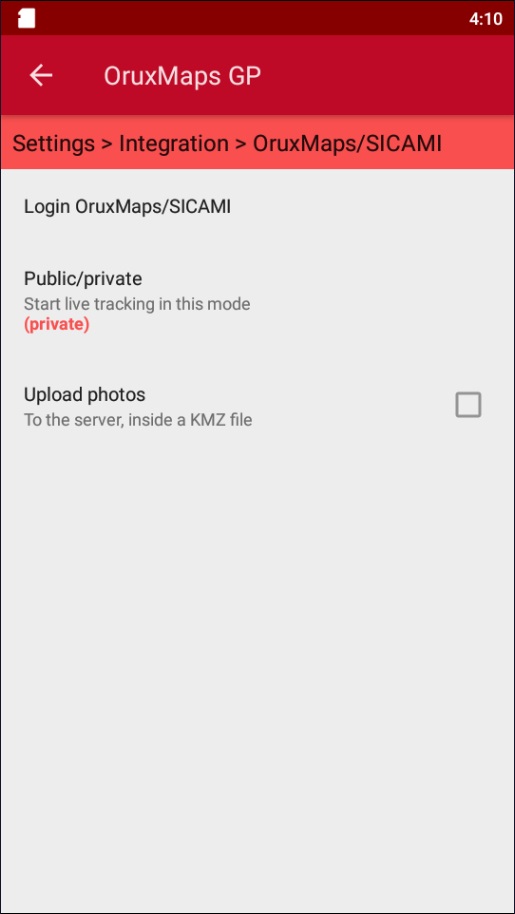
These settings can be configured later by accessing ‘Integration’ and selecting the linked app.
Manually upload routes to Sicami or Strava
Routes can also be transferred or uploaded to Sicami or Strava.
In order to do so, you will need to follow these steps:
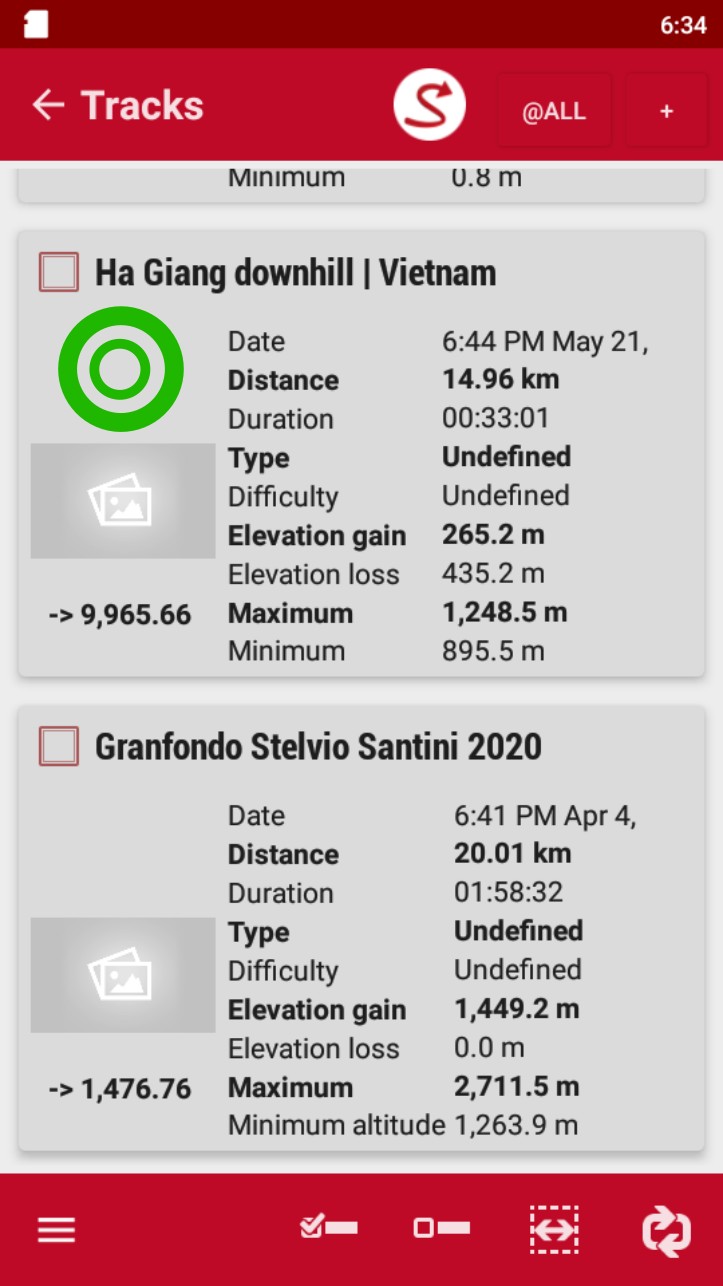
- Access the Tracks/Routes list.
- Tap in the one you want to transfer.
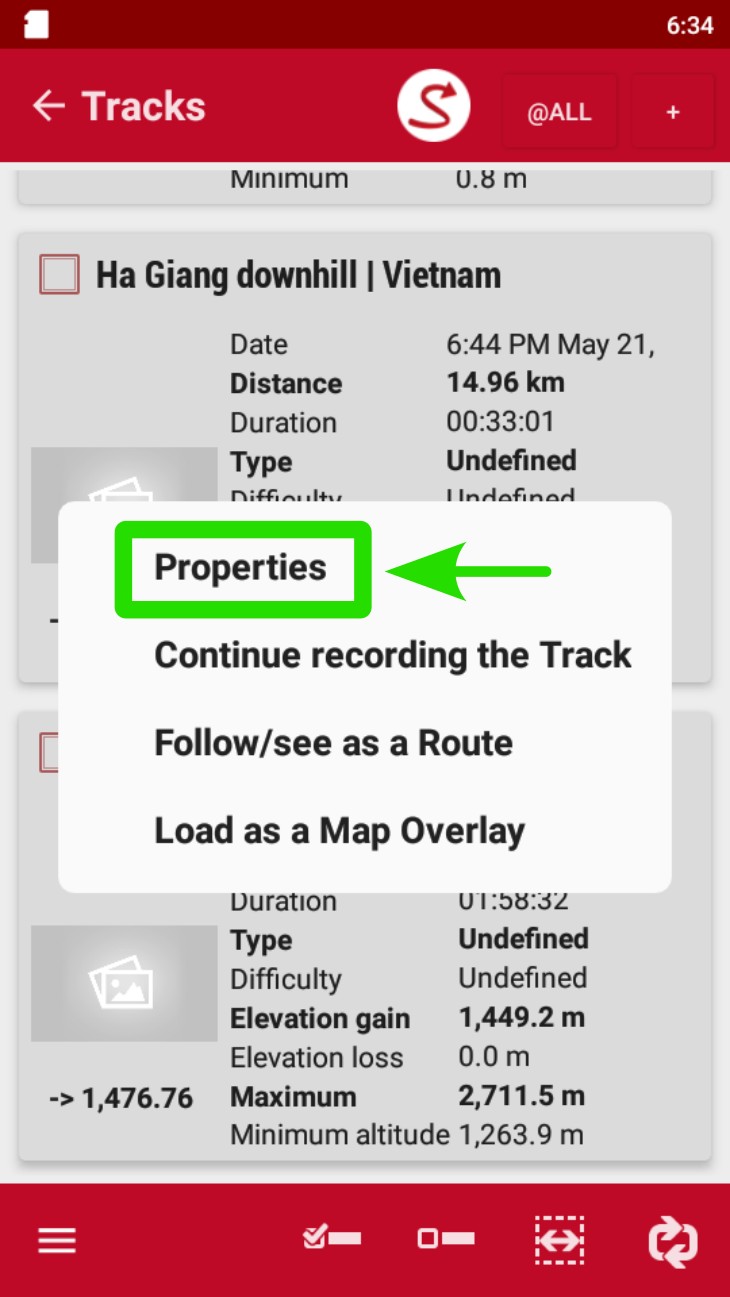
- Tap on “Properties” on the pop-up window.
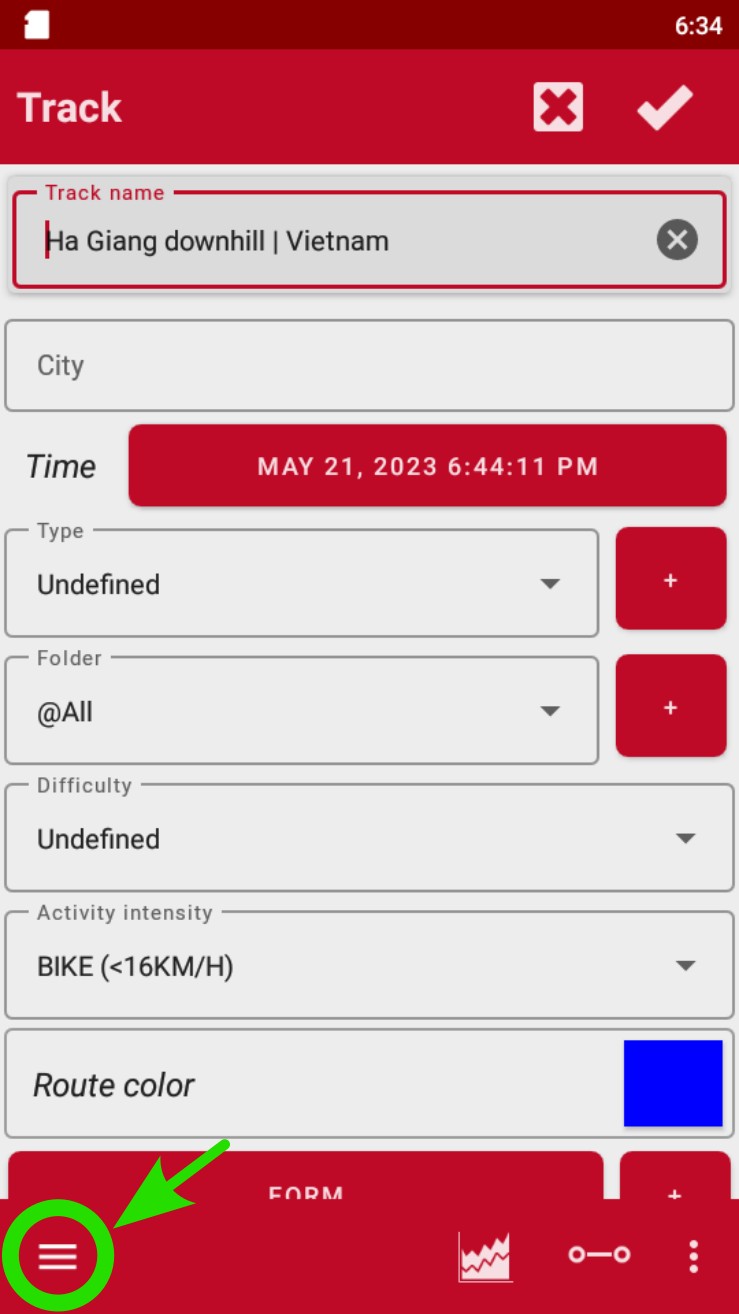
- Tap on the Configuration panel (three horizontal lines) at the bottom left corner of the screen.
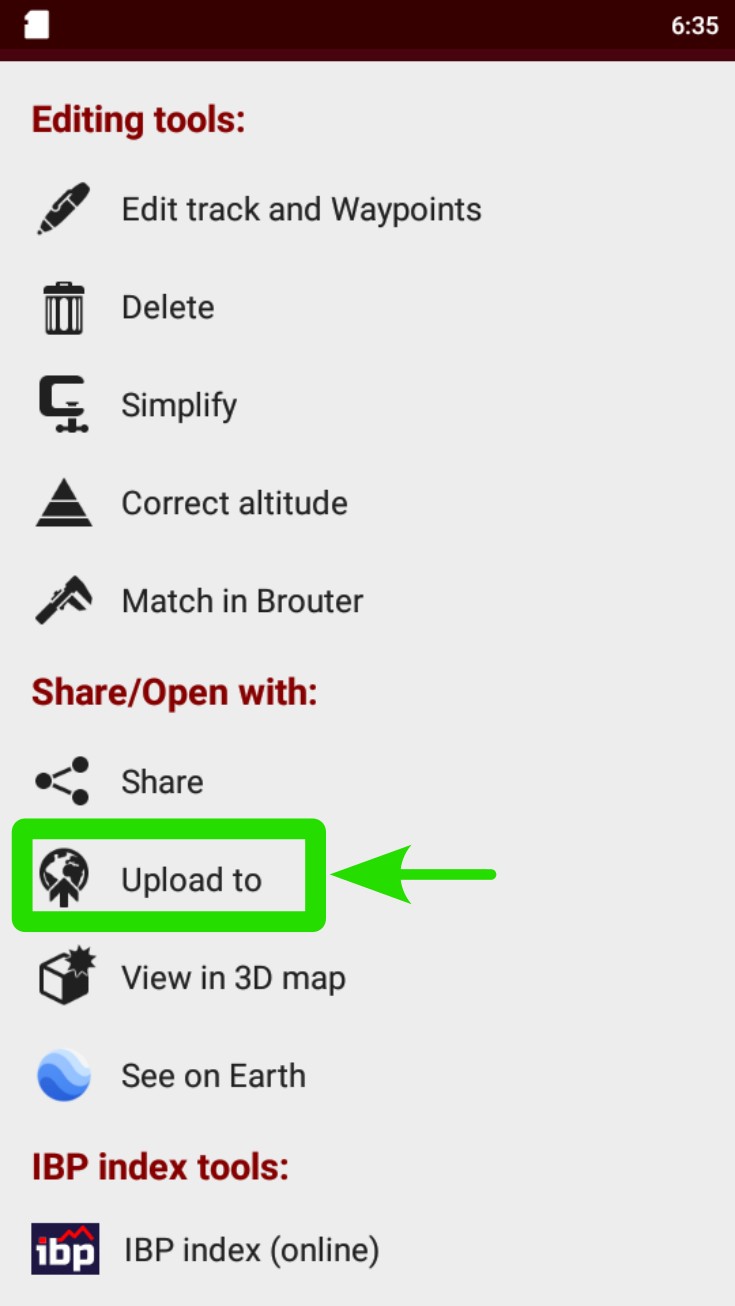
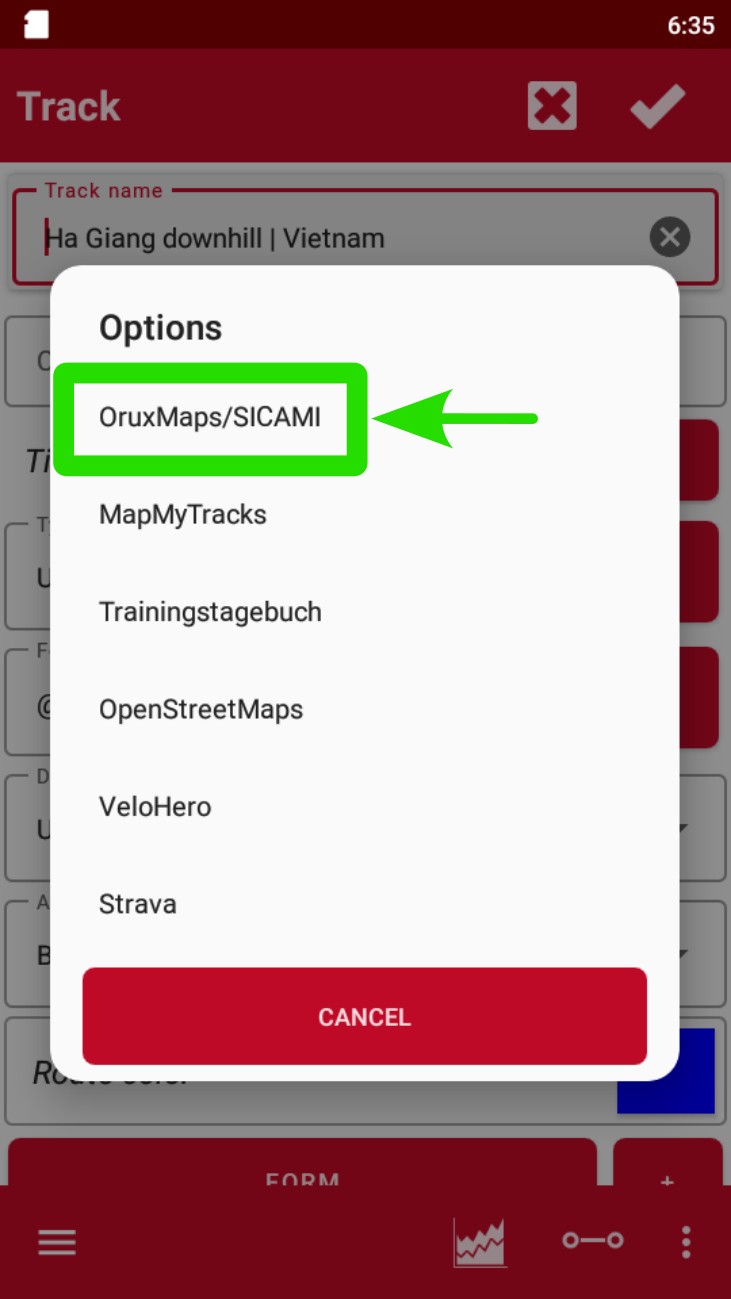
- Select "Upload to".
- Check "SICAMI" or Strava.
Next, the following steps are shown in a video and various screenshots.
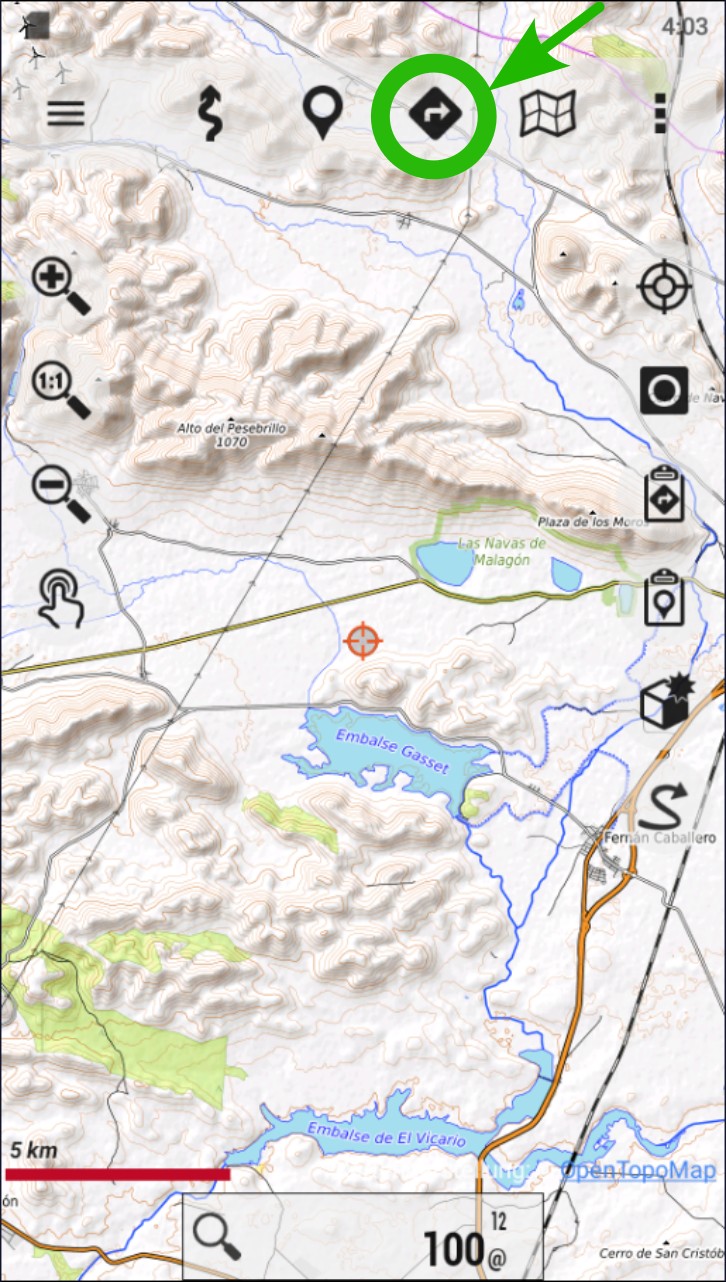
Tap on the NAVIGATION icon. It is also accessible through the “Tracks” button on the right side buttons.
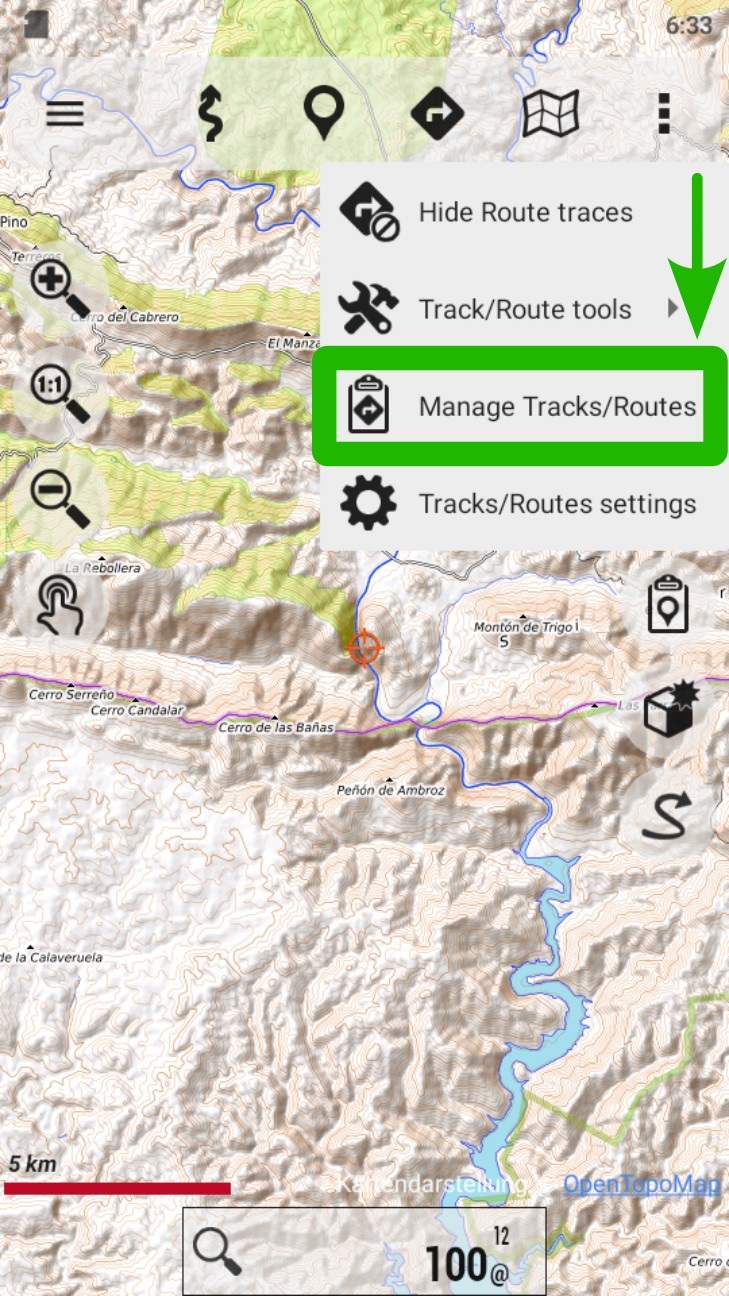
Go to “Manage Tracks/Routes”.
Tap on the desired track/route to open the contextual menu.
Go to “Properties”.
Tap on the configuration panel on the left corner.
Tap on “Upload to”.
Select SICAMI, Strava or the desired app.
##publi##
Maps for Oruxmaps and other resources and utilities
Maps for Oruxmaps
We are going to give some information about where we can get maps for oruxmaps.
We will also indicate where to get DEM files of altitudes to use in Oruxmaps.
And we will let you know some sites that have very useful information related to Oruxmaps, as a reference place we always have to talk about https://tronpoonpo.blogspot.com.
Mapsforge Offline Maps
for Oruxmaps, maps for oruxmaps offline, to be able to work offline, these are maps that we can use without internet connection, that's why we will have to download them previously / insert them in our android device (phone or tablet). Here are some addresses where you can get them.
https://www.openandromaps.org/en
https://osm.paws.cz/index.php
https://download.mapsforge.org
Offline Points of Interest for Oruxmaps. Points of interest are geographical locations where you can find something useful or interesting (water fountains, pharmacies, monuments, etc).
https://download.mapsforge.org/pois/
https://www.openandromaps.org/en
Offline Garmin Maps
being offline we can also use them without internet connection and it will also be necessary to load them in our device previously.
The files of these maps must be placed in the Oruxmaps folder called "mapsfiles".
They can be downloaded from https://garmin.opentopomap.org/ and also https://alternativaslibres.org/.
If the downloaded file is compressed (zip extension) we will have to decompress it ourselves.
In tronpoonpo.blogspot you can find a great article with more information about this kind of maps (https://tronpoonpo.blogspot.com/2021/07/mapas-garming.html).
You can also find explanations on how to use these maps in oruxmaps in the following link: https://alternativaslibres.org/es/use.php#use_android
Online Maps sources (onlinemapsources.xml)
This is a file that with a little knowledge we can modify ourselves to incorporate many online maps / layers to oruxmaps. We can also find this file already filled in if we do some search on the internet or if we ask for it in a forum related to Oruxmaps.
In this file we can add WMS and WMTS online maps.
Offline maps very wanted (Openandroimaps):
Map of Spain and Portugal
https://ftp.gwdg.de/pub/misc/openstreetmap/openandromaps/mapsV5/europe/Spain-Portugal.zip
Map of Portugal
https://ftp.gwdg.de/pub/misc/openstreetmap/openandromaps/mapsV5/europe/Portugal.zip
Map of Italy (North and South)
https://ftp.gwdg.de/pub/misc/openstreetmap/openandromaps/mapsV5/europe/Italy-North.zip
https://ftp.gwdg.de/pub/misc/openstreetmap/openandromaps/mapsV5/europe/Italy-South.zip
Map of France (North and South)
https://ftp.gwdg.de/pub/misc/openstreetmap/openandromaps/mapsV5/europe/France-North.zip
https://ftp.gwdg.de/pub/misc/openstreetmap/openandromaps/mapsV5/europe/France-South.zip
Maps of Morocco:
https://ftp.gwdg.de/pub/misc/openstreetmap/openandromaps/mapsV5/africa/Morocco.zip
https://www.openandromaps.org/en/downloads/africa
##publi##
Websites related to Oruxmaps.
https://tronpoonpo.blogspot.com/
Where to download DEM files of elevations.
https://sonny.4lima.de/
This is an article from Tronpo's blog where related topics are explained:
https://tronpoonpo.blogspot.com/2021/07/dem.html
Create offline maps for oruxmaps from an online map from the Oruxmaps itself.
This option gives us the possibility to create an offline map from an online map in order to use it without coverage / data. We can also download only the necessary part of the map to be able to follow a route, this process is very useful if we already have the route, as we will save time and storage space in the download.
Not all maps allow you to do this, for example those of IGN if it is possible.
https://tronpoonpo.blogspot.com/2021/07/creador-de-mapas.html
Convert an image into a map
In this great article Tronpo explains how to do it:
https://tronpoonpo.blogspot.com/2022/04/imagen-mapa.html
Easy aerodynamics for cyclists and some tips
Easy aerodynamics for cyclists and some tips
Aerodynamics is the branch of fluid dynamics that attempts to describe and quantify the forces acting on an object immersed in a gaseous fluid, usually air, when the object is moving, when the fluid is moving, or when both are moving.
Any cyclist who has ever cycled in a headwind has experienced how exhausting it is to ride through the invisible mass of moving air in front of you. You will also have noticed that the faster you go, the more air resistance you experience and the more energy you must exert to overcome it. We call this force or resistance to progress aerodynamic drag.
Air pressure and friction
We can divide aerodynamic drag into two components to be overcome:- resistance due to air pressure
- direct friction or air friction against the surfaces of the rider and the bicycle.
The air pressure. Pressure difference
The moving cyclist disturbs the air flowing around him, forcing the air away from his surface to make way for him. This increases the pressure at the front. On the other hand, the opposite effect occurs at the rear of the cyclist, creating regions of lower pressure that result in a "pressure drag" against the cyclist.
With high pressure at the front and low pressure at the rear, the cyclist is literally pulled backwards.
Air friction
Aerodynamic designs and close-fitting clothing help air circulate more smoothly around these bodies and reduce pressure resistance, while minimising turbulence through the air by using specially designed airfoil shapes.
The frictional force is smaller in magnitude and is caused by the friction of the air in contact with the outer surface of the rider and the bicycle.
On flat courses, aerodynamic drag is by far the biggest barrier to a cyclist's progress, accounting for 70 to 90 percent of the resistance felt when pedalling.
Mathematical formula for aerodynamic drag
To better understand how each of the elements involved affect each other, we will study, without going into too much depth, the well-known formula for the frictional force or aerodynamic drag of a body in the air.

In this formula:
- ρ is the density of air in kg/m3. It varies with altitude and other parameters such as temperature (inversely proportional) or atmospheric pressure (directly proportional).
- Vw is the relative speed, in metres per second, between the air and the cyclist, for headwinds the speed of the cyclist shall be added to the wind speed.
- Cd is the drag coefficient, which is a property of the shape and surface texture of the object. It is dimensionless (unitless).
- S is the frontal cross-sectional or projected area, in m2, of the bicycle-cyclist combination. It is not the total surface area, but the area occupied by the bicycle-cyclist combination when viewed from the front.
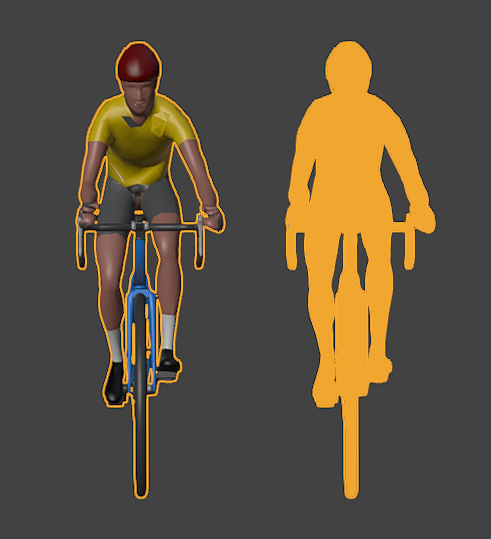
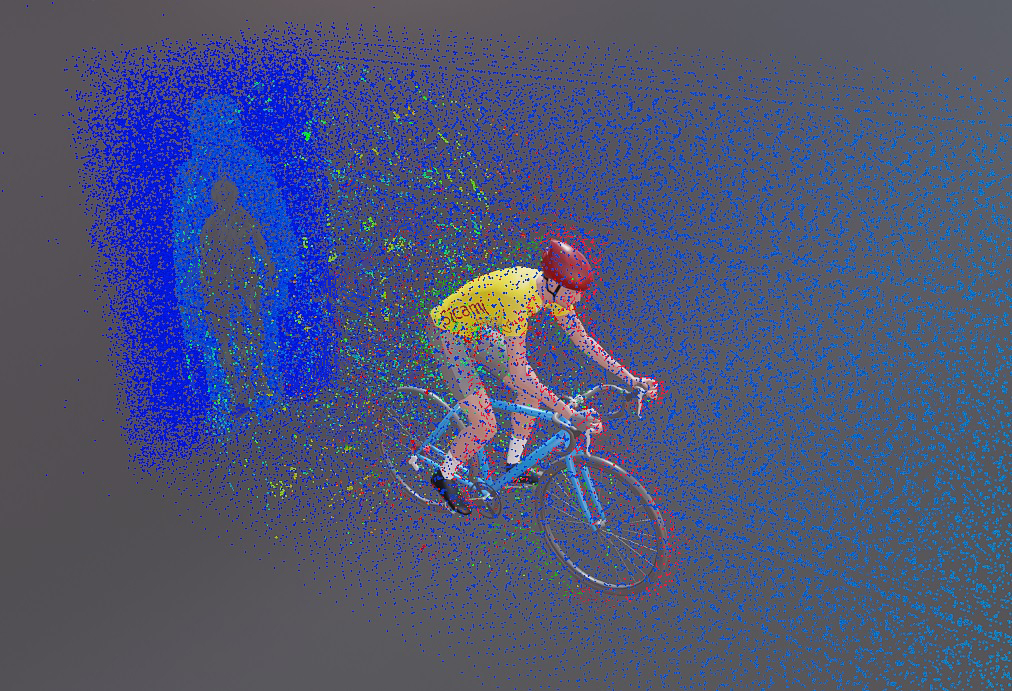
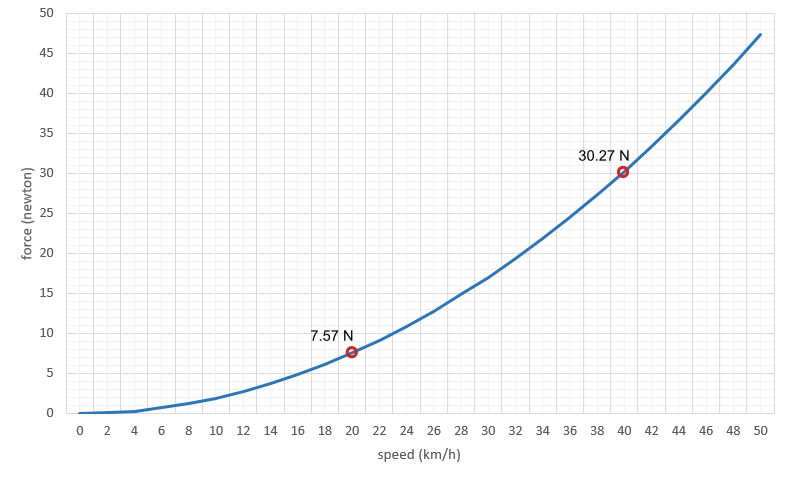
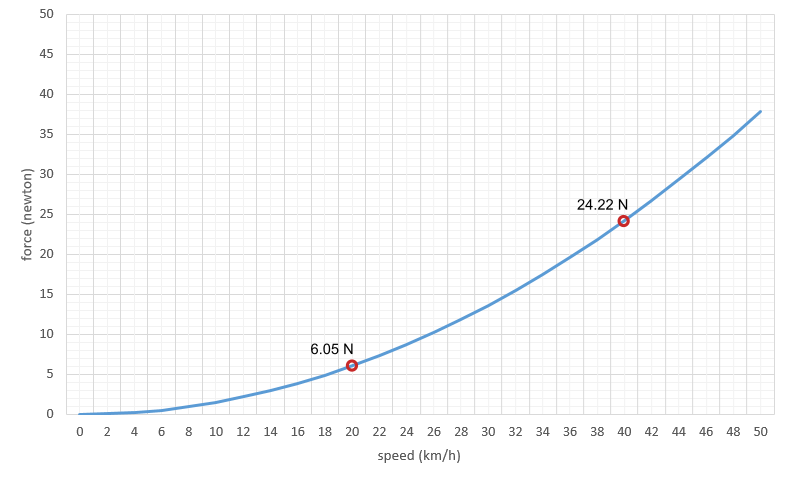
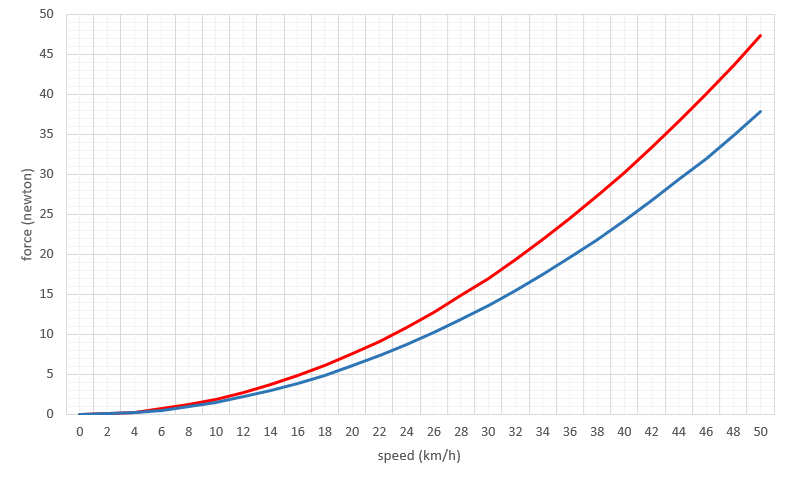
It is very important to note that in the above formula the speed is squared. This means that the aerodynamic force does not double as the speed doubles, but that its value increases quadratically.

Conclusions and recommendations
For touring cyclists, recreational cyclists or those who are not concerned about their own personal best, it seems that the best strategy for tackling headwinds would be to slow down, exactly the same as for tackling a climb, and take it easy. As well as adopting a posture and equipment that reduces the exposed frontal area as much as possible.
In more competitive scenarios we should consider:
- Try to be more aerodynamically efficient at higher speeds, such as flat stretches and descents.
- Relax the position on low speed sections, such as ascents, where aerodynamic resistance is less important in favour of the force of gravity, which is determined by the weight of the cyclist-bicycle combination.
Just as important is that the position on the bike allows you to continue pedalling comfortably, so that the effort and fatigue are sustainable over time. The fastest position will be the one in which we minimise the impact of aerodynamic resistance, but which we can maintain for as long as possible.
Recommended article: Physics of cycling: Forces. Basic notions
Hiking trails
Hiking trails. Concepts and definitions.
A trail is a narrow path, usually located in rural areas or natural regions, primarily for pedestrian and livestock traffic. When this traffic is higher, they tend to become wider and turn into sidewalks. They allow passing through these regions and sometimes connect small towns and villages to each other or to points of livestock, agricultural or scenic interest.
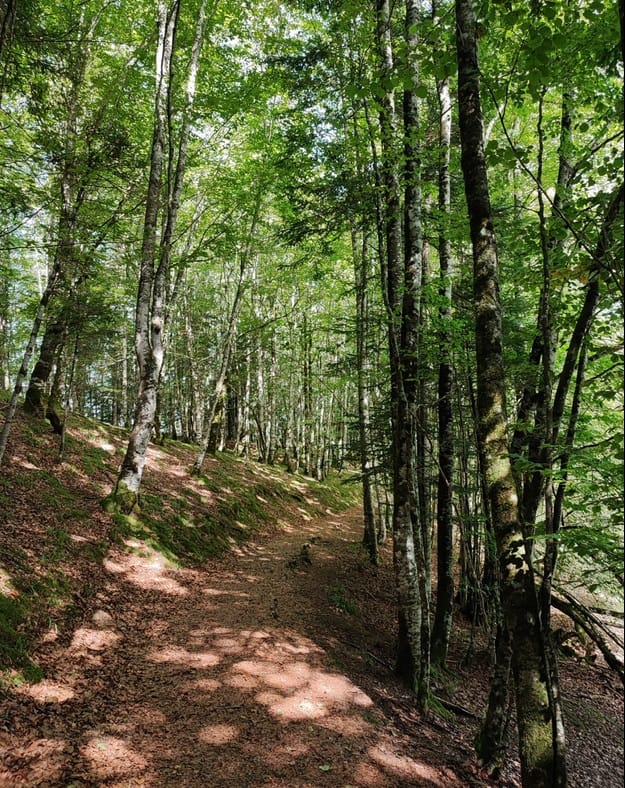
These paths are usually not signposted and are not paved or prepared for vehicle traffic, and are mainly travelled on foot, by bicycle, motorbike or on horseback.
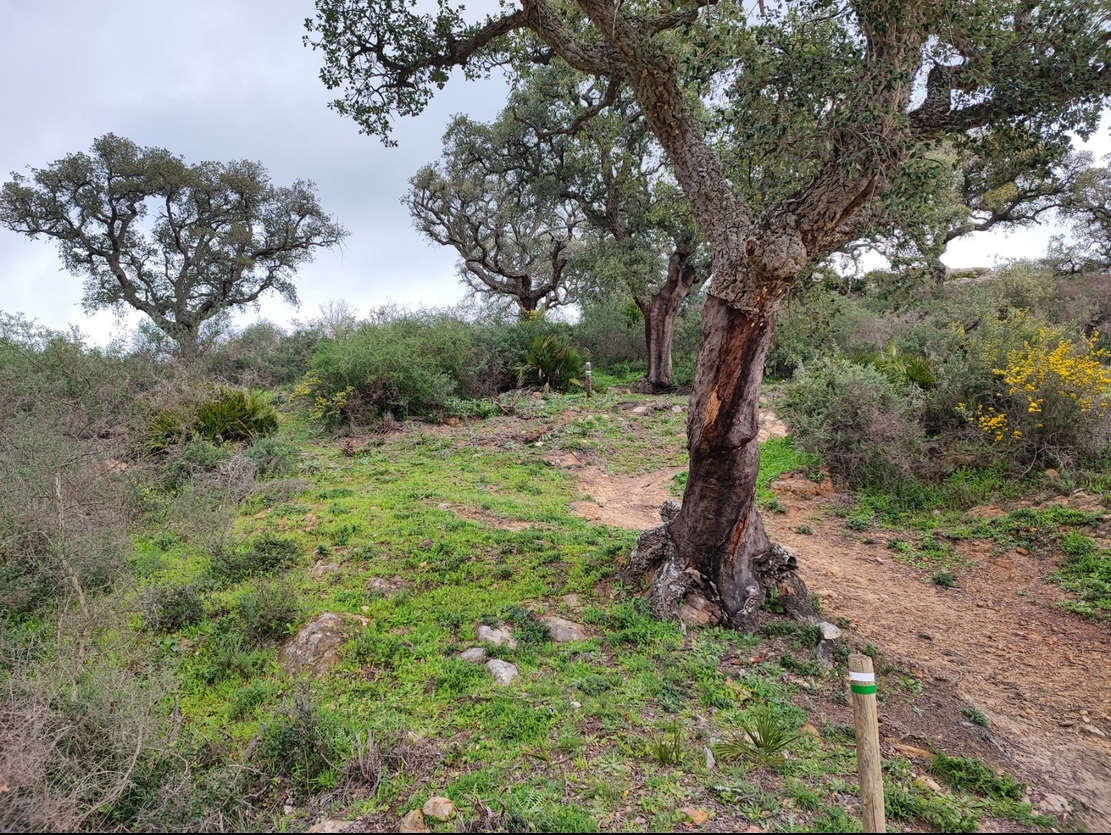
A hiking route is a route, to be done on foot, that runs mainly along these types of paths, which can be made up of trails, footpaths, paths, cattle tracks, royal paths, royal roads, firebreaks..., with hiking being the leisure practice consisting of walking along paths of these characteristics. Nowadays, it is a growing activity that allows people of all ages and levels to enjoy nature, with a wide variety of routes of varying difficulty and duration.
Follow a hiking route
To follow a hiking route and not get lost along the way, it is advisable to have a map, preferably a topographical one, which shows the different geographical features and on which the route is marked. In addition to instruments for calculating position and orientation, such as a compass, it is advisable to have a map, preferably a topographical one, which shows the different geographical features and on which the route is marked.
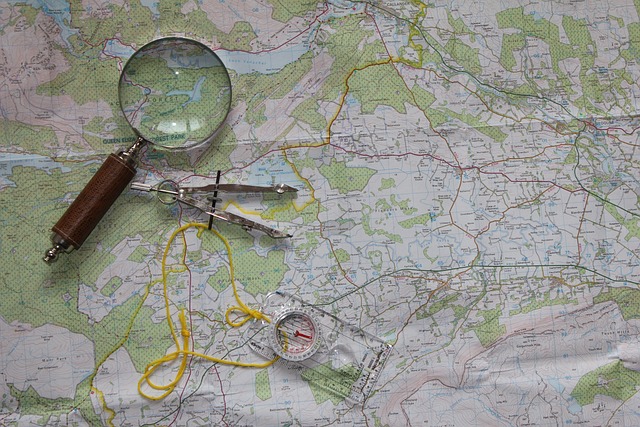
Digital topographic maps are now available for use on dedicated GPS devices or mobile phones which, together with GPS satellite positioning systems, allow the position on the map to be obtained and displayed with high accuracy.
There are also specific applications that allow you to load the hiking route and display it on the map so that following it is easy, very visual and intuitive.
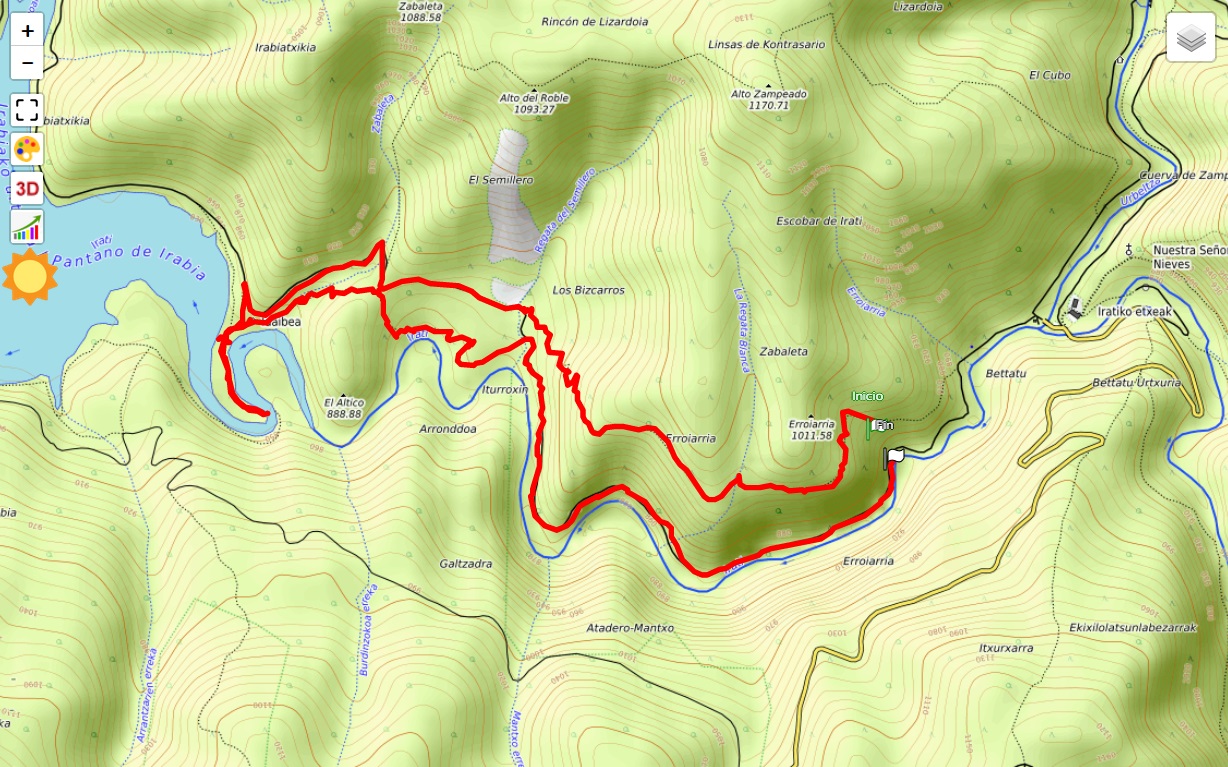
Create a hiking route
There are different ways to create a hiking route, although the most common is to generate them automatically as they are done on the ground or by drawing them on a map in an application that later generates the corresponding file. For the former, Oruxmaps is probably the most powerful application, with a large number of configuration and customisation options.
Once the route is created and stored in a standard exchange format, usually GPX, it can be shared with other users.
Hiking trail apps and websites
There are websites specialised in sharing routes on the internet where they can generally be downloaded for free, such as Wikiloc, Strava, Sicami Tracks or AllTrails, among others, although to obtain advanced features such as route analysis, etc., it will almost always be necessary to pay for some kind of subscription. Together they constitute a repository of millions of routes.
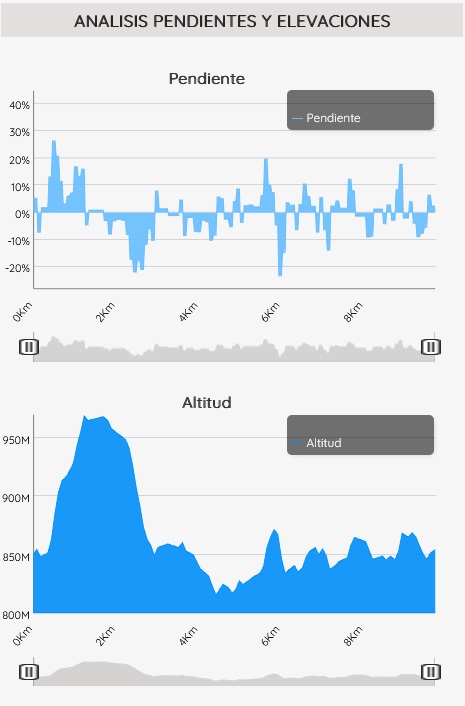
As examples of additional functions, which we show here for Sicami Tracks, as they are offered under subscription at no cost, we can have the analysis of the route according to various parameters, such as the slope of the terrain or the altitude:
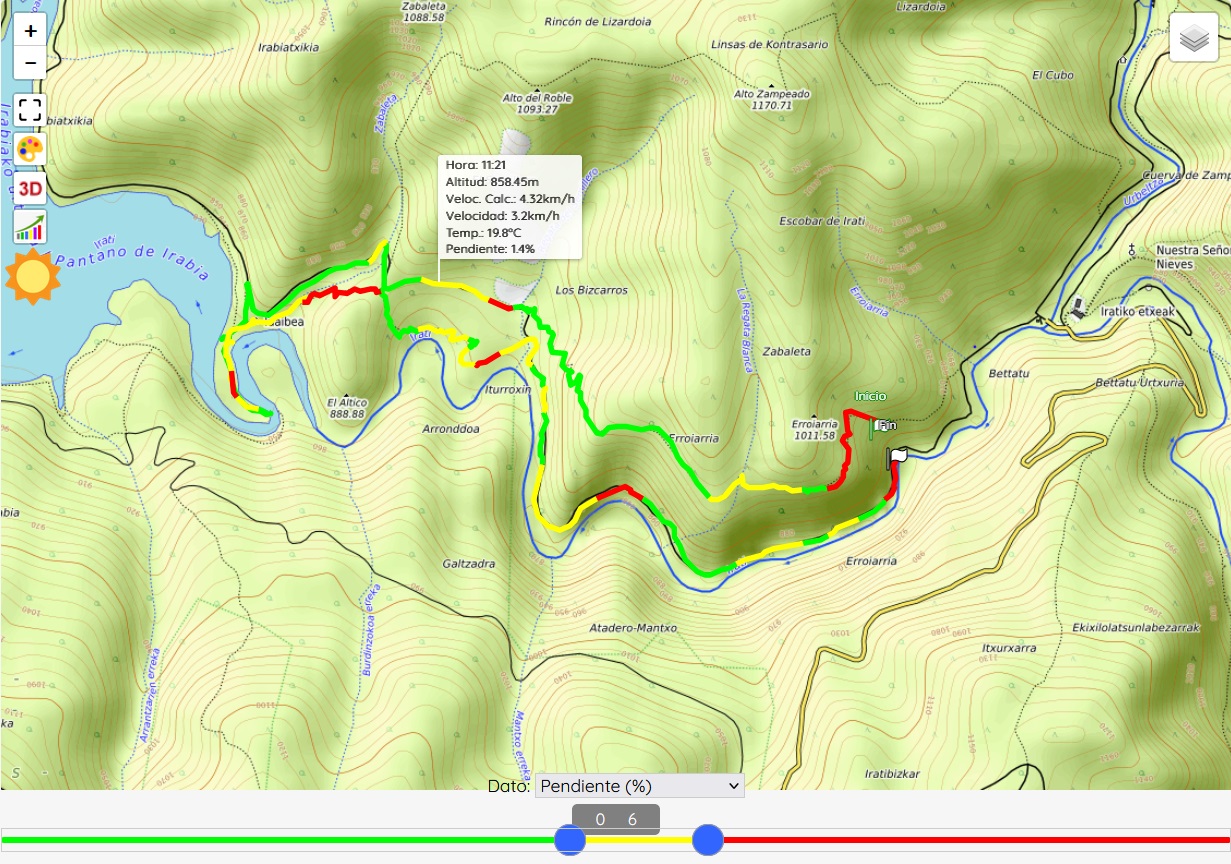
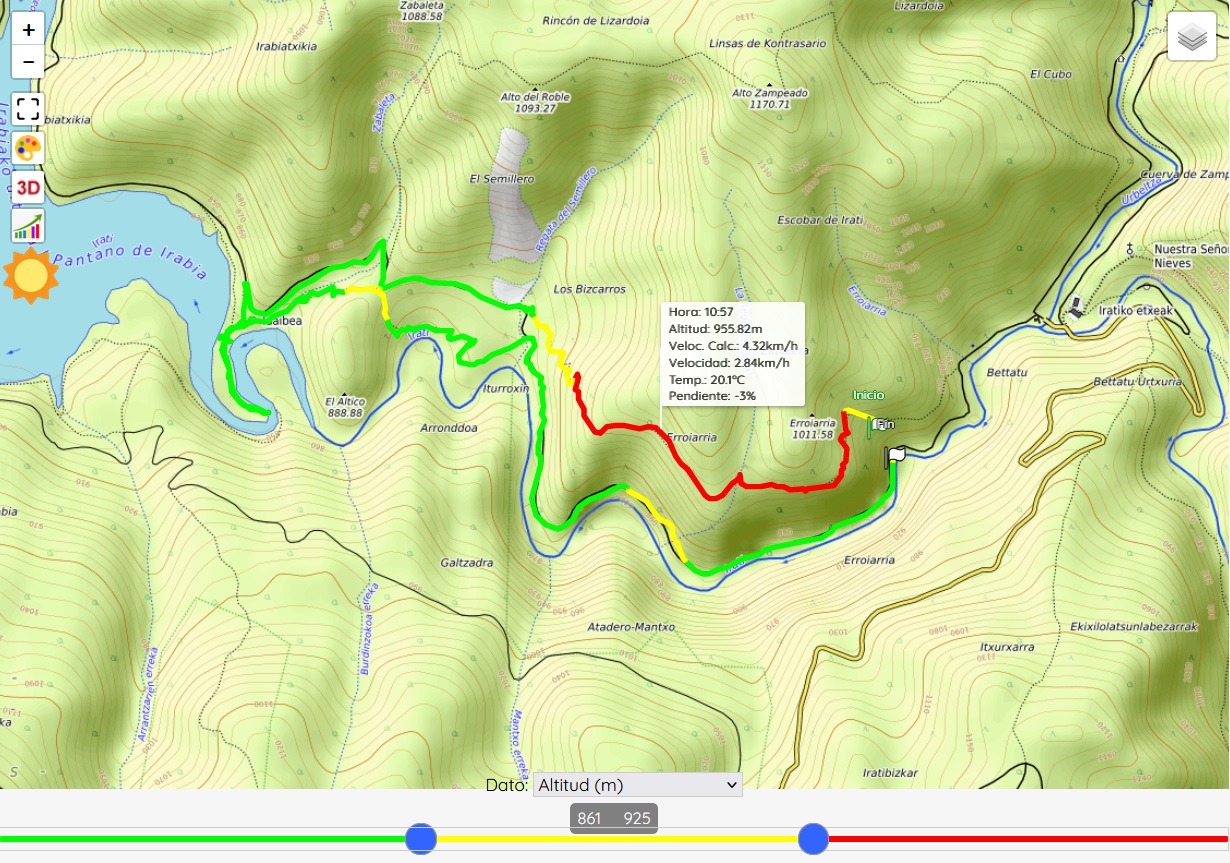
It is also possible to add waypoints to which comments or clarifications can be associated, and even multimedia elements such as photographs or videos.
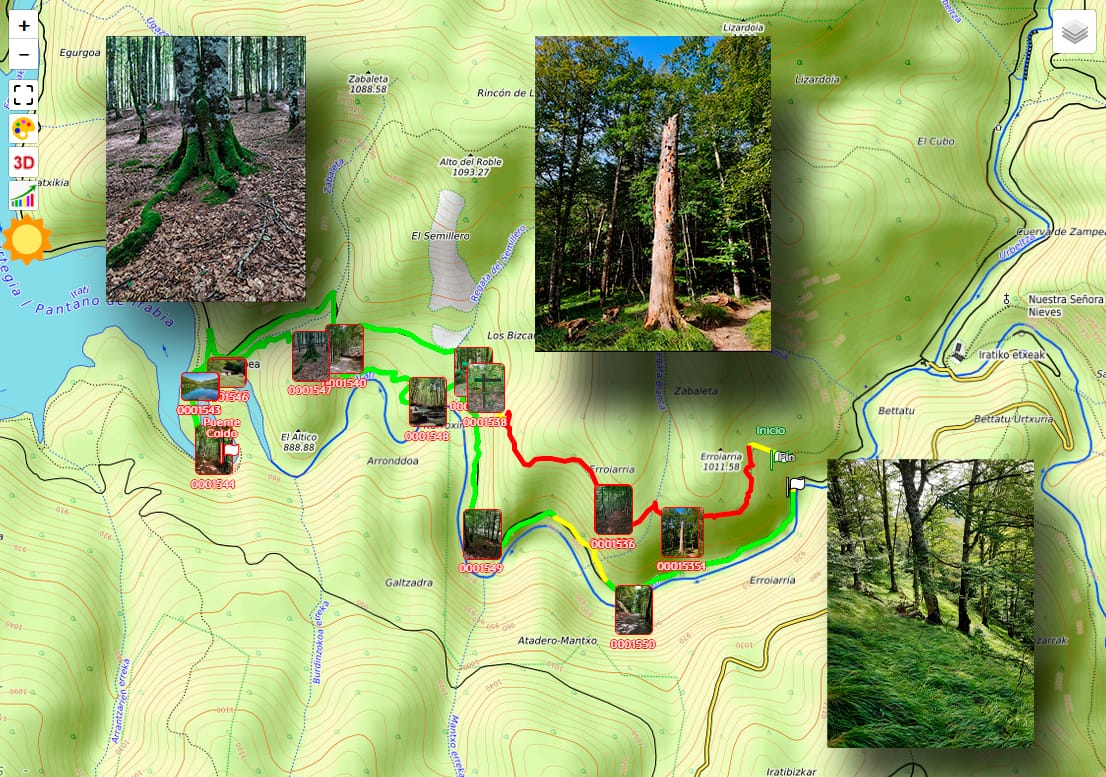
It will even be possible to visualise the animated route in three-dimensional 3D.
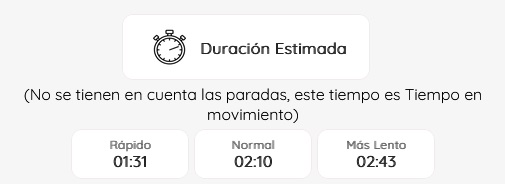
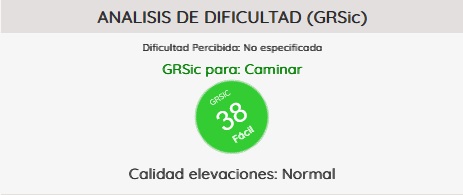
As well as other functions related to the characteristics of the route such as the estimated duration of the route, indicative level of difficulty,
Effective and efficient time management. Tips and recommendations.
Effective and efficient time management. Tips and recommendations.
- In our health: stress or anxiety is a risk factor for the onset of some diseases, cardiovascular or digestive disorders. It also affects our mental health and can lead to anxiety disorders, addictions, depression, etc. The absence of breaks (which should be included in the time planning) is one of the most common causes of the lack of time having an impact on health.
- In our work: reduced performance, work stress, burnout, the inability to take on interesting tasks because we do not have time for them, or the loss of objectives.
- In our personal life: friends, partner, family...
On the other hand, the causes of poor time management can be:
- Personal attitude
- Setting overly ambitious goals that consume a large amount of time.
- Poor allocation of time to tasks.
- Irregularity in following the steps to achieve a goal.
- Not knowing how to say "no" or not knowing how to delegate tasks.
- Lack of clear objectives or not having them correctly defined.
- Lack of priorities that leads us to maintain an intense but uncontrolled activity.
General recommendations and tips.
-
- Set objectives that mark the path to follow: do not get lost and wander around aimlessly, this wears you down enormously. For objectives to be useful, they must be measurable, achievable, realistic, specific and adjustable.
- Over the course of a few days, make a study of how we spend our time: record everything we do and the time we spend on it. In this way we will find out if it is possible to optimise our time and increase our performance.
- Analyse repetitive tasks or actions to see if they can be optimised or even eliminated. Identify bottlenecks.
- Use the agenda and to-do lists: improvising is not bad, but it is not the best way to organise your time. Try to plan your weeks including time for contingencies and rest.

- Delegate tasks: sometimes you can't do everything. If possible, we should rely on people who offer their help or who we believe can take care of what we do not absolutely have to do ourselves.
- Giving written instructions to delegated staff will avoid having to repeat them.
- Learn to say no: so that we do not find ourselves attending to the tasks of others, less relevant, and so that we can strive for what is important (that which is directed towards our objectives) and not so much for what is urgent.
- Leave demands and perfectionism for times when we are more available and calm. We have to do our best, but always within the time available.
- Try not to be distracted by things that can be done at another time or that, if we think about it, are not so important and hinder us from achieving our objectives.
- Establish mechanisms to manage possible "disturbances" in time that may appear.
- Set aside time for contingencies and changes.
- Plan: manage the planning of all professional and personal activities.
- Establish realistic schedules for work and other activities, including leisure and extra-work activities in general.
- Develop the ability to be flexible in the modification of planning.
- Organise documents, the workplace, tools, clothes, tools, etc. correctly.
- From a purely work-related point of view, the better worker is not the one who dedicates more hours to work, but the one who does more useful things in the same hours (PRODUCTIVITY).
As we have indicated above, it is highly advisable to analyse the day to try to identify the different periods of time into which we can divide it according to the level of activity, level of calm and our own capacities. Some will be caused or conditioned by external agents such as periods of greater activity due to visits, calls, etc. or periods of greater calm due to the absence of these. In other cases, they will be caused or conditioned by internal agents such as staff timetables or our own work capacity.
Therefore, in order to distribute activities and adapt our capacities to different periods of time, we should also analyse what our own personal capacities are, our response at each moment of the day. Our energy peaks and troughs, and our response to different circumstances.
Once the tasks have been identified and classified, establishing their importance, urgency and the need for resources and time to be spent on each of them, we can organise the time available according to the periods of activity, our own capacities and with the help of tools such as the task list and the Eisenhower matrix.

Effective time management essentially consists of acquiring the necessary skills and abilities to plan time properly, with the aim of improving our efficiency in the different areas of our lives (work, family, social, personal, etc.).
Recommended article: Effective and efficient time management. Eisenhower Matrix
Effective and efficient time management. Eisenhower, Stephen, Covey matrix.
Effective and efficient time management. Concepts.
Effectiveness: Achieving an objective in the time specified (or in less time), regardless of the resources used.
Efficiency: Achieving the goal using the least possible resources, including time.
"Lack of time" is one of the main problems we all suffer from nowadays and it is also often one of the main excuses to postpone our outings or training. Reconciling our jobs, family obligations, household chores, etc. with our sports or outdoor activities can be a complex and even overwhelming task.
We are going to try that this "guide" or list of keys, tips and advice will help us to achieve it or at least improve it.
As the task that usually occupies most of this time is work, being also one of the main sources of stress, we will focus especially to this work, although it is valid for any area of life.
A tool for time management that can be very illustrative, giving an interesting overview, is the Eisenhower or Sephen Covey matrix.
In this way we will define IMPORTANT, NOT IMPORTANT, URGENT and NOT URGENT tasks.
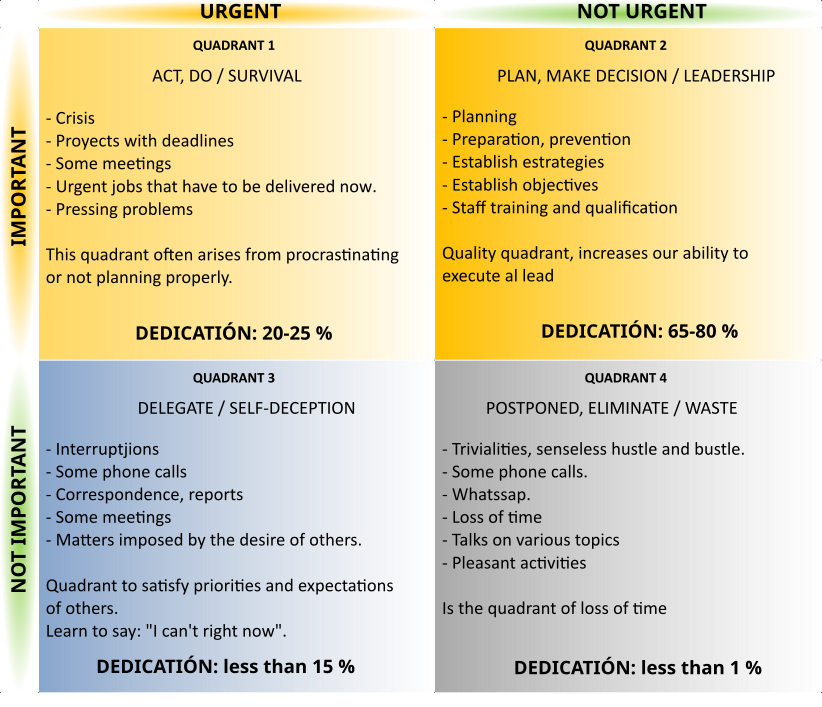
QUADRANT 1: The crisis and stress quadrant, should only be used for unforeseen events, so we should not have planned activities in this quadrant. If they exist, it will be for exceptional crisis situations, otherwise it denotes a problem of organization and management. Therefore, we must minimize the tasks in this quadrant, which is achieved by working correctly in quadrant number 2. Tasks that are really important and urgent require immediate attention and the longer we delay in finishing them, the more stress and exhaustion they will cause.
Concentrating on quadrant 2 minimizes quadrant 1.
QUADRANT 2: The planning quadrant. This is the quadrant to which we should dedicate the most time, as it affects medium- to long-term objectives and its correct management will minimize unforeseen events.
QUADRANT 3: Non-important but urgent tasks. It is advisable to delegate them if possible or to automate them by setting up a system that allows them to be done in the most optimal way. Self-deception occurs because the tasks in this quadrant may require you to spend a lot of time on them, making you feel very busy, but they do not represent any important progress.
QUADRANT 4: Tasks that are neither important nor urgent, in which case it would be best to postpone or eliminate them, as they are a waste of time and do not allow any progress to be made.
Keyss:
PROCRASTINATION: Action or habit of delaying activities or situations that should be attended to, replacing them with other more irrelevant or pleasant situations. Recurrent procrastination will cause you to spend the most time in quadrant 3 and 4, none in quadrant 2 so you will often find yourself in quadrant 1, stressed by serious situations that are already out of control.
TASK LIST: List of tasks to be performed.
IMPORTANCE: Importance is associated with the consequences we will have. Something is more or less important depending on the severity of what will happen to us if we do not do it.
URGENCY: Urgency is associated with time. It is increased by the deadline and by the size of the task. If two tasks take the same amount of time to complete, the one with the earlier deadline is more urgent. If two tasks have the same deadline, the more urgent is the one that takes longer to complete.
Importance has more "force" than urgency.
PRIORITIZE: To establish the priority of each task. Give order in time.
Who determines importance and urgency? Usually, in the workplace, importance and urgency are determined by the head of the department. It is advisable not to be afraid to ask questions in order to be clear about the priorities of each task.
What benefit do I get as a worker? Again focusing on the work field, good time management will result in less stress, fewer fights, fewer problems, better results and greater professional recognition.
Method:
Step 1: List all the tasks or objectives to be accomplished regardless of their importance or urgency for the time being.Step 2: Attribute to each task its importance, scoring from 1 to 5, with 5 being the highest importance.
ONLY NUMBERS 4 AND 5 GIVE THE HIGHEST URGENCY OR IMPORTANCE.
Step 3: Attribute to each task its urgency, scoring from 1 to 5, with 5 being the highest urgency.
Step 4: Relate the tasks in the matrix.
ONLY NUMBERS 4 AND 5 GIVE THE HIGHEST URGENCY OR IMPORTANCE.
STEP 4: Link the tasks in the matrix.
Recommended article: Effective and efficient time management. Tips and recommendations
Modelling a bicycle brake or derailleur cable terminal for 3D printing
Creating a simple model for 3D printing with OpenSCAD
We are going to perform a simple example of using 3D modeling techniques for subsequent 3D printing.We will manufacture a terminal for brake cable and / or change of bicycle.
For modeling we will use OpenSCAD, free software for the creation of 3D solid objects because it is free to use and also allows parametric design, so it will be possible to later modify the dimensions to adapt the model to each particular need.
OpenSCAD download link: https://openscad.org/
We begin by drawing up a sketch that represents our initial idea.
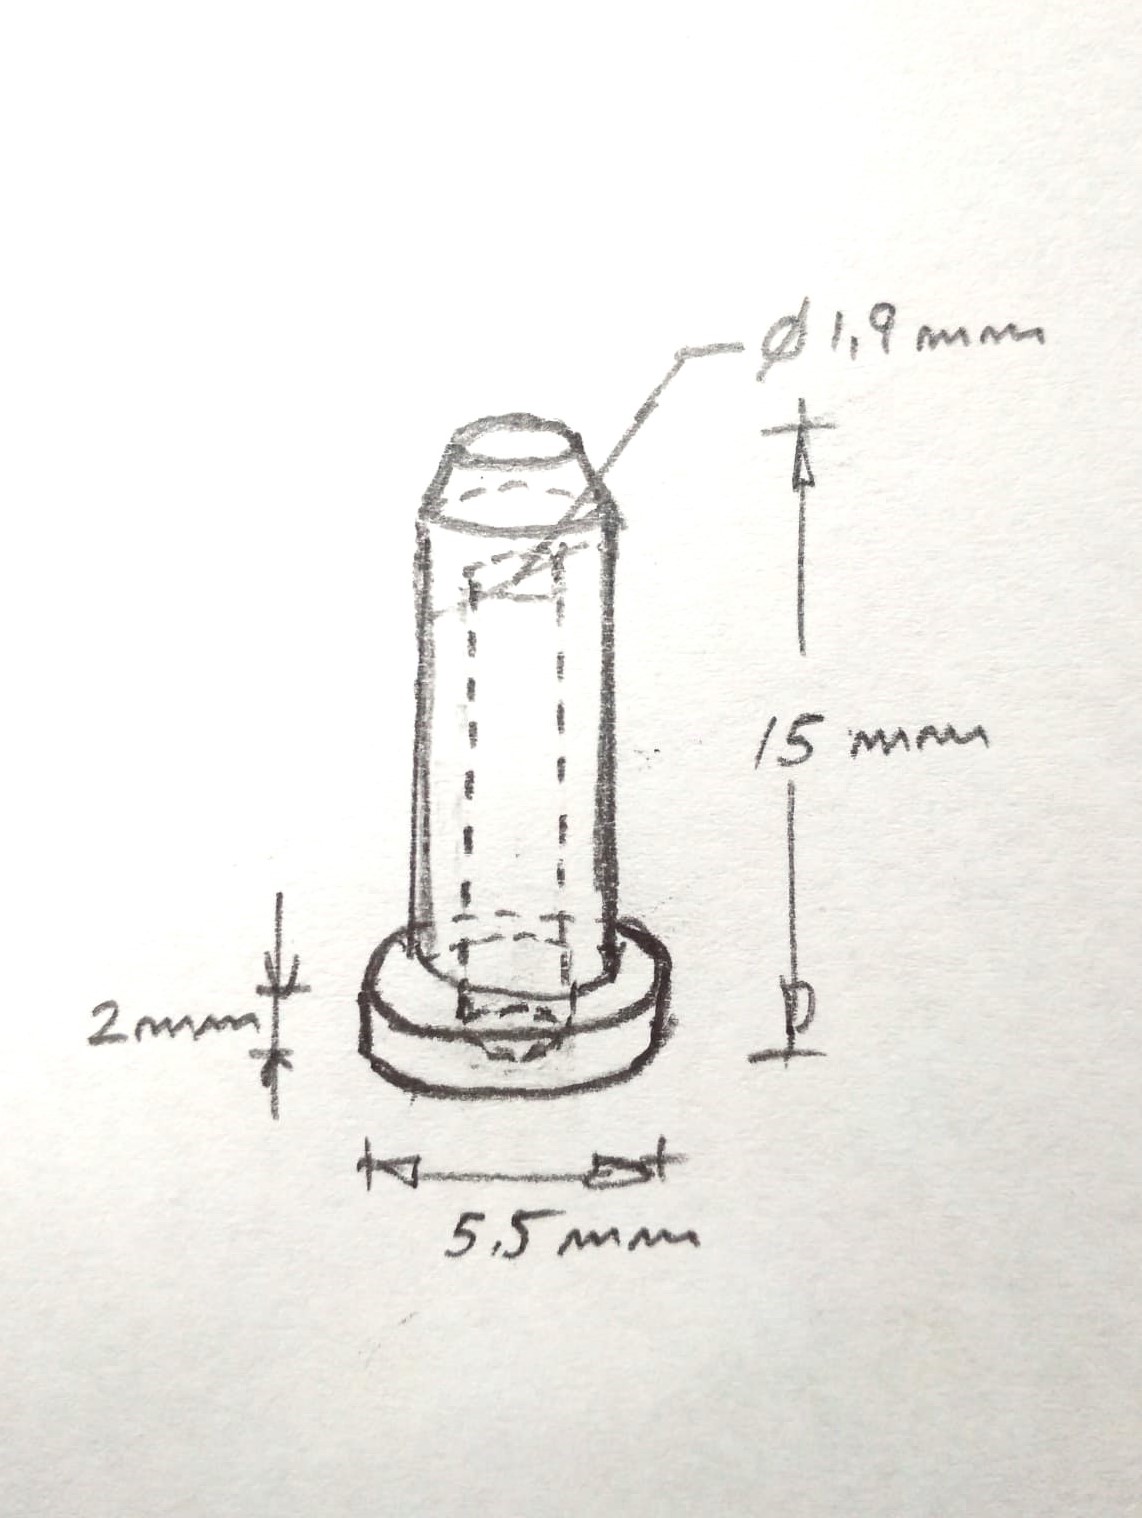
Already in openSCAD, let's start with the base drawing a cylinder of diameter 5.5 mm. and height of 2 mm.
cylinder(d=5.5, h=2, $fn=100);
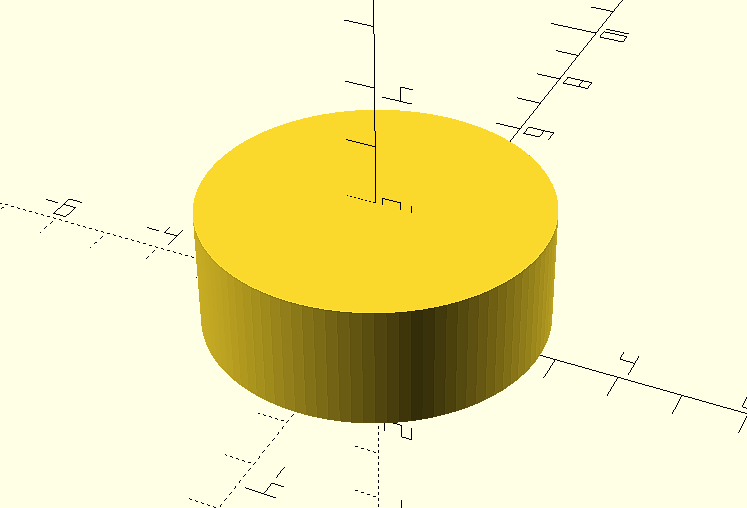
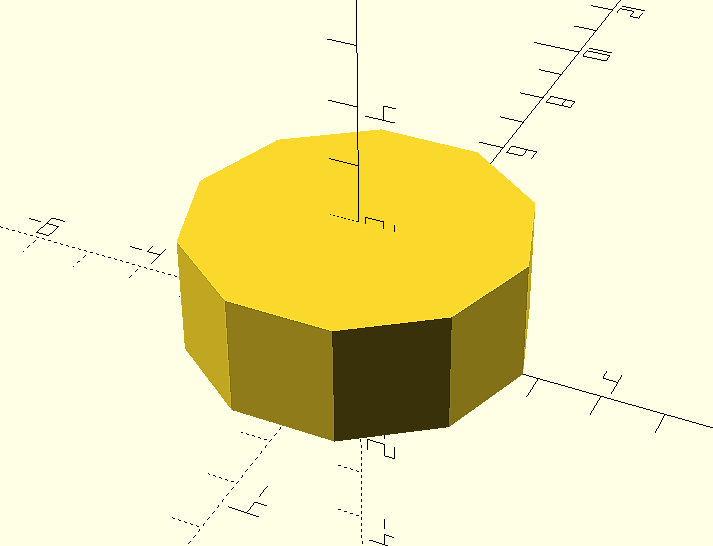
The variable parameter $fn is used to indicate the number of segments that will form the base circle of the figure and therefore the number of faces of the cylinder. This would be the result for a value $fn = 10
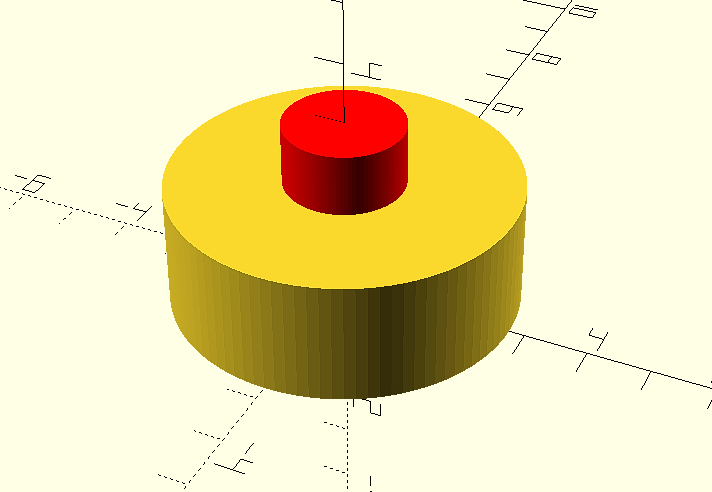
The bore will be another cylinder of the same or greater height and diameter of the bore:
cylinder(d=1.9, h=3, $fn=100);
In the following figure it is represented in red color and with a height of 3 mm. for better visualization.
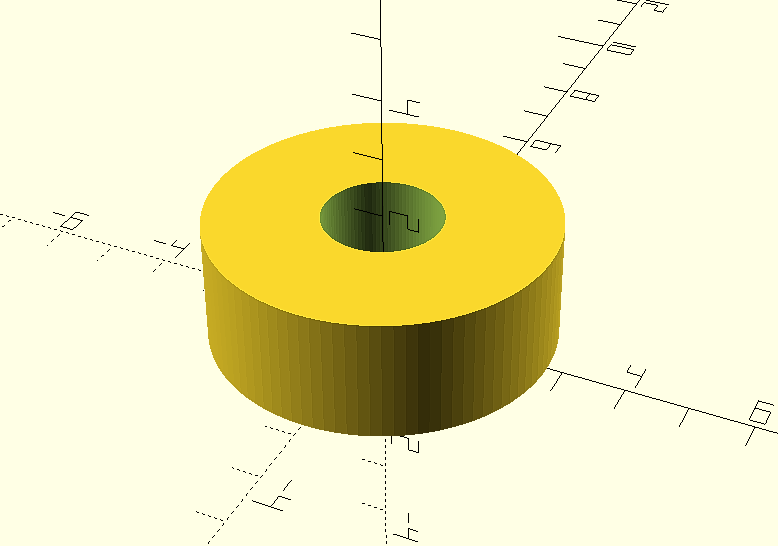
But now what we have are two overlapping cylinders, so that the second cylinder is the perforation of the first one we will use the modifier “difference()” that will make the difference between the first and second elements indicated:
difference(){
cylinder(d=5.5, h=2, $fn=100);
cylinder(d=1.9, h=3, $fn=100);
}
We are going to create the second cylinder or main body of the object, its diameter will be 4 mm. and its length will be 13 mm.
cylinder(d=4, h=13, $fn=1000);
To make its initial position coincide with the upper face of the base cylinder, we will move it 2 mm along the vertical axis "Z" using the transformation “translate ([x, y, z])”:
translate ([0, 0, 2])
cylinder(d=4, h=13, $fn=1000);
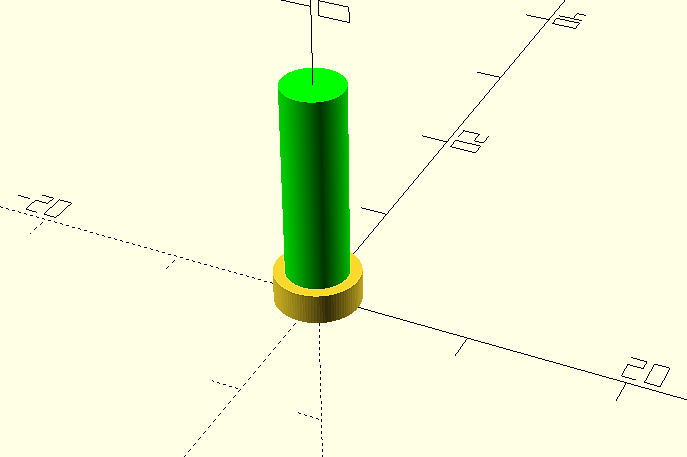
We will drill the hole as we saw before, although in this case we do not want it to go through its entire length, so its length will be less than 1 millimeter.
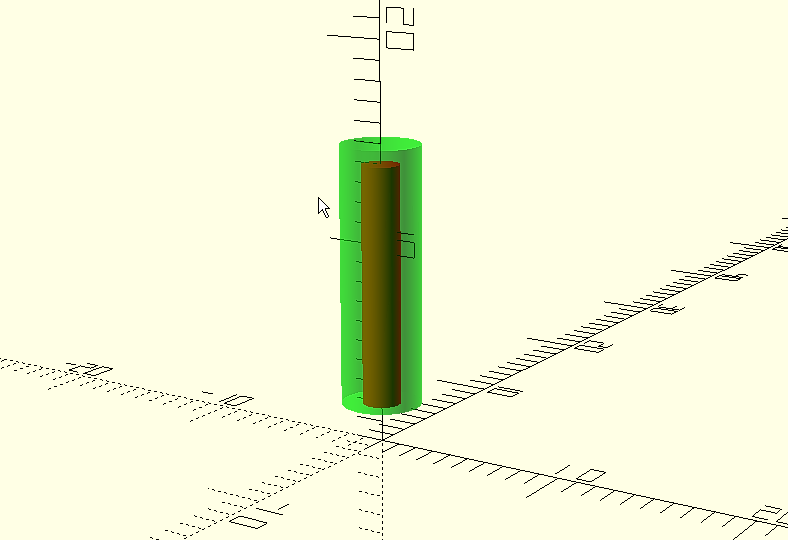
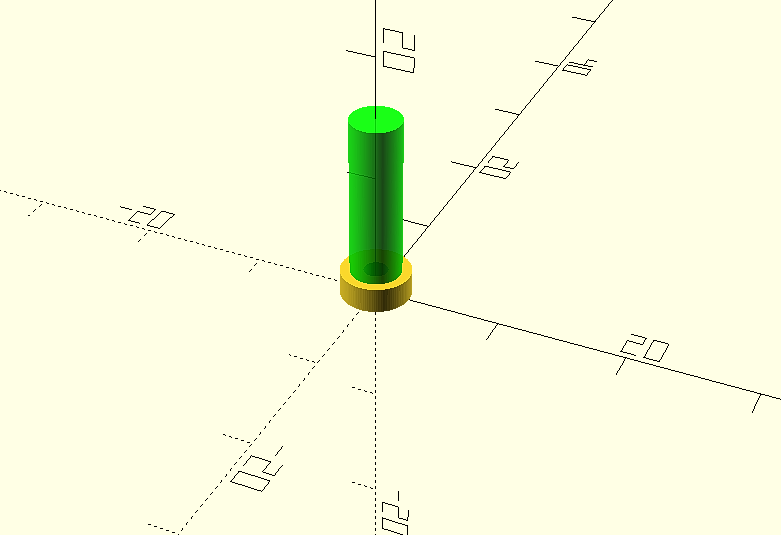
difference(){
translate([0,0,2]);
cylinder(d=4, h=13, $fn=1000);
cylinder(d=1.9, h=12, $fn=1000);
}
Now all that remains is the upper chamfering. In this case we will do it as a third element, again we will use a cylinder, but we will define a smaller diameter for the upper face. We will use again the primitive "cylinder" to create a cylinder of height h=1, lower diameter d1=4 and upper diameter d2 =2.
cylinder(h=1, d1=4, d2 = 2, $fn=100);
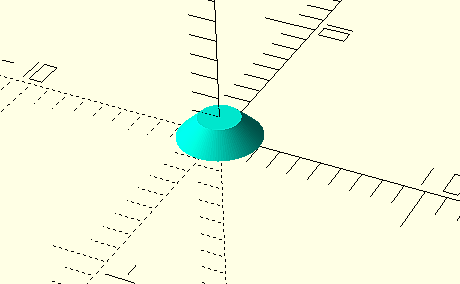
And again we move it to its correct position at the upper end of the terminal.
translate([0,0,15]);
cylinder(h=1, d1=4, d2 = 2, $fn=100);
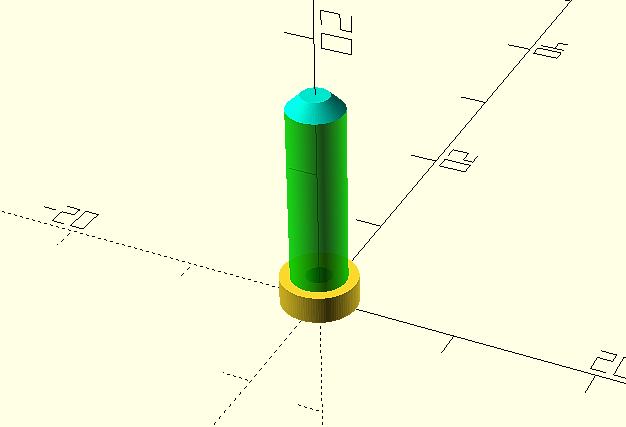
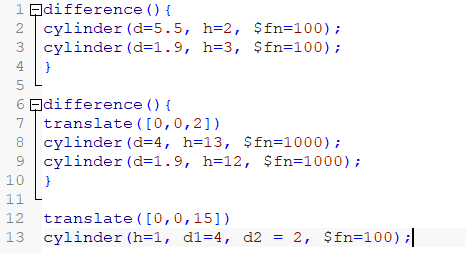
The final result, including the complete code will be:
difference(){
cylinder(d=5.5, h=2, $fn=100);
cylinder(d=1.9, h=3, $fn=100);
}
difference(){
translate([0,0,2])
cylinder(d=4, h=13, $fn=1000);
cylinder(d=1.9, h=12, $fn=1000);
}
translate([0,0,15])
cylinder(h=1, d1=4, d2 = 2, $fn=100);
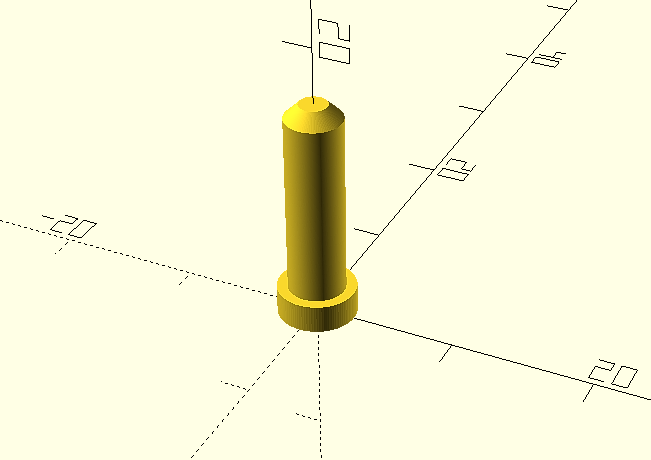
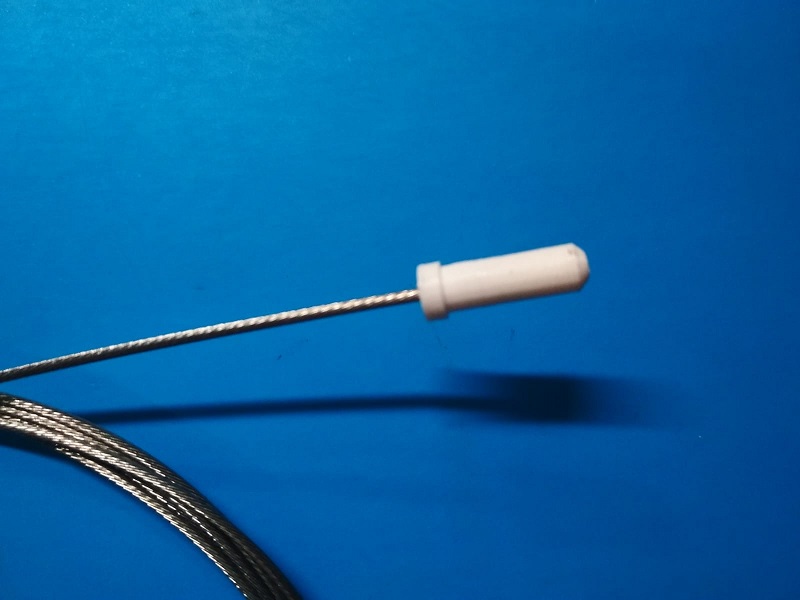
Then we will render it (F6) and export it for 3D printing, in our case in .STL format. And this will be the final result once printed.
Eratosthenes of Cyrene. Calculation of the radius of the Earth.
Eratosthenes of Cyrene (276 BC - 194 BC). The radius of the Earth
Eratosthenes was a mathematician, astronomer and geographer, born in 276 B.C. in Cyrene, an ancient Greek city in present-day Libya, known, among other contributions, for his work on estimating the radius of the earth.
As director of the Library of Alexandria (Egypt) he was aware of observations indicating that in Syene, now Aswan, at noon on the summer solstice (when the Sun reaches its highest position in the sky) it was observed that objects cast no shadow and the light entered the wells to the very depths. This meant that the sun's rays fell perpendicular to the earth in that area.In Alexandria, on that same day, the objects did cast shadows. That is, those same sunbeams did not fall perpendicularly, but at a certain angle.
It should be noted that Eratosthenes already held that the earth was curved, so this difference in the angle of incidence of the sun's rays reinforced his belief.
He also believed that the sun was far enough away to consider that its rays would reach the earth practically parallel to each other.
Moreover, if the sun entered the well all the way to the bottom, he could infer that, if they were prolonged, they would reach the center of the earth.
The distance between Alexandria and Syene was about 5,000 stades, a measure used at the time which, although not known exactly, is estimated to be equivalent to about 158 meters.
Eratosthenes was able to measure the angle at which the sun's rays hit Alexandria and the result was approximately 7º 12'. The method he used to obtain it is not known. .
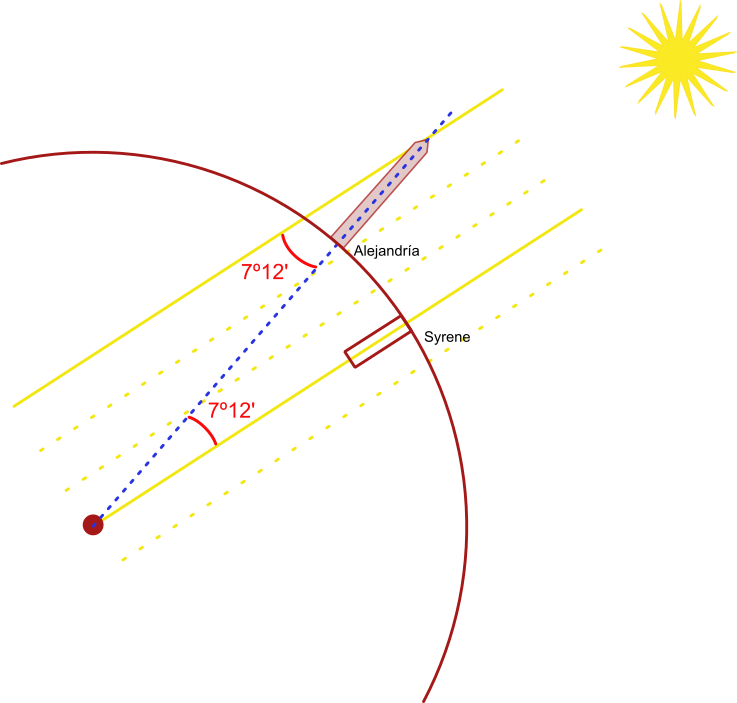
Knowing that the full circumference comprises 360º, Eratosthenes divided by the 7.2º measured, resulting in approximately 50 times the circumference:
360 / 7.12 = 50
from which he inferred that the circumference of the earth should be about 50 times the distance between Alexandria and Siena, that is 50 x 5000 = 250,000 stades.If we take into account the estimated value in meters for a stade we will have that the circumference of the earth would be:
250.000 stades x 158 meters/stade = 39.500.000 meters = 39.500 km
By that time Archimedes had already made an approximate calculation for the value of PI by setting it at 22/7 and the relationship between the length of a circle and its radius was known:
Clearing the radius in the above formula:

Using the values obtained by Eratosthenes:

If we take as valid the 158 meters that each stade was supposed to measure:
39.772 · 158 = 6.283.976 meters = 6.284 km.
The Earth is not perfectly spherical, so it does not make sense to speak of a single radius, we can find that the radius at the equator is 6,378 km while the polar radius is 6,357 km. As a reference, 6,371 km is considered to be the average radius in a spherical modeling of the Earth.This is an example of the application of basic geometry and that ancient civilizations were not necessarily intellectually primitive.
Coordinate reference systems. Datum. Basic concepts.
Coordinate reference systems. Datum. Basic concepts
The Datum is a geodetic reference system consisting of an ellipsoid, on which a coordinate system has been established to allow the location of any point on its surface and its position in relation to the Earth.
Fundamental point
In order to establish this coordinate reference system it is necessary to previously establish a clear relationship between the relative positions between the ellipsoid and the geoid so that the ellipsoid fits as well as possible to the region where it will be used. For this it is necessary to define a point common to both, where both coincide and which will be a tangent point to the ellipsoid and the geoid. This point is called "fundamental point". The fundamental point will be defined by its geographical coordinates of longitude and latitude.
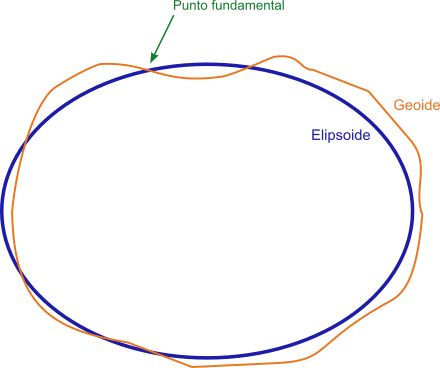
At present, satellite systems have made it possible to develop global datums, where the origin of coordinates is usually established at the center of mass of the Earth.
Local or regional Datums and global Datums
Therefore, we can distinguish between local or regional datums and global datums.
Local datums
Local datums define an origin and location of a coordinate system valid for a certain area of the Earth, although not for all of it, and consists of the ellipsoid defined by its axes and flattening index and by its "fundamental point".Global datums
In the global Datums the geometric center of the ellipsoid usually coincides with the center of mass of the Earth and there is no "fundamental point" as such.An example of a local datum would be the European datum ED 50 that uses the Hayford Ellipsoid with semi-major axis a = 6,378,388 meters and flattening f = 1 / 297. Its origin for longitudes is the Greenwich meridian and its Fundamental Point is located in Potsdam (Germany) at coordinates 52º22'51.446 "N 13º03'58.741 "E.
As an example of global datum we would have the WGS84 that uses the GRS_1980 Ellipsoid with semi-major axis a = 6.378.137 meters and flattening f = 1 / 298,25722356300003. Its longitude origin is the Greenwich meridian and it has no fundamental point as it is global.
Datum WGS84
The GPS systems use internally the WGS84 Datum so it is convenient to configure the Datum of the device according to the cartography that we are using. The device will be in charge of making the appropriate conversions so that the coordinates of each point coincide on the map. In the same way, the tracks in GPX format that are generated by a GPS device will always store the coordinates according to the WGS84 Datum.
Vertical Datums
As in the case of the Datum for horizontal coordinates, in the case of vertical coordinate systems a vertical Datum is established which will be the surface to be taken as a reference with zero elevation or altitude. In practice, normally data from measurements and calculations stored in elevation raster files will be used.Orthometric altitude and ellipsoidal altitude
The two surfaces to be used will be the ellipsoid and the geoid which gives rise to two definitions of altitude or height:
Orthometric altitude or orthometric height: When the reference surface is the geoid, equivalent to the altitude above mean sea level. The orthometric height will be the distance between the point on the ground and the geoid in the direction of gravity or "plumb line". This distance can be positive or negative depending on whether the point is above or below the surface of the reference geoid. They are commonly used for topographic mapping.
Ellipsoidal altitude or Ellipsoidal height: When the reference surface is the ellipsoid. The ellipsoidal height will be the distance between the point on the ground and a line perpendicular to the ellipsoid. This distance can be positive or negative depending on whether the point is above or below the surface of the reference ellipsoid. This model is the one used by GPS systems.
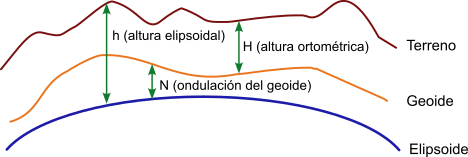
Relationship between orthometric and ellipsoidal altitude
If data on the geoid undulation in a certain area are available, it is possible to obtain the approximate orthometric height from the ellipsoidal height by applying the following relation:
Undulation of the geoid = ellipsoidal height - orthometric height,
N = h - H
from where:
Orthometric height = ellipsoidal height - geoid undulation,
H = h - N
Coordinate reference systems. Ellipsoid and geoid.
Coordinate reference systems. Ellipsoid and geoid. Basic concepts
For the representation of a geographic data, it is necessary to have a spatial reference that positions it on the surface of the Earth, that is, a coordinate reference system. These geographic data are currently in the form of digital files, according to two models, the vector model, which is composed of points, lines and polygons, and the raster model, which consists of cells of a matrix or grid.
The vector model is appropriate for discrete objects or phenomena with clear boundaries (parcels, buildings, cadastre, etc.), while the raster or matrix structure model, by allowing each unit of the matrix to be assigned a different value, is more appropriate for quantitative variables, such as temperatures, rainfall, etc. that vary according to x and y position, as well as in the vertical position.
Whatever the model, it must incorporate a reference system of both horizontal and vertical coordinates, indicating the vertical position with respect to some reference system.
Earth's shape, the ellipsoid.
The shape of the earth is approximately spherical. Although it is generally accepted that the regular geometric shape that best fits the real shape is the ellipsoid of revolution.
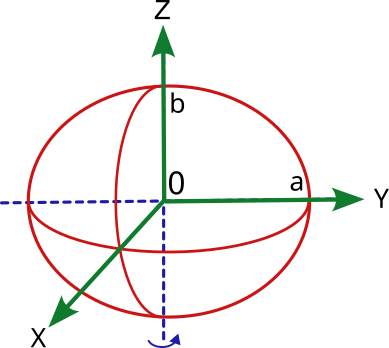
An ellipsoid of revolution is generated when an ellipse is rotated in space around one of its axes. The ellipse is defined by two axes, one horizontal "a", the other vertical "b" and a flattening index "f" being: f = (a-b)/a
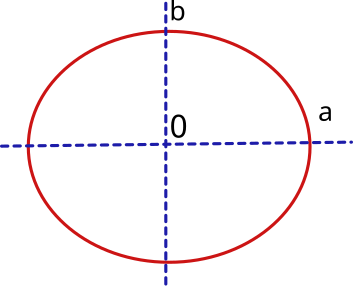
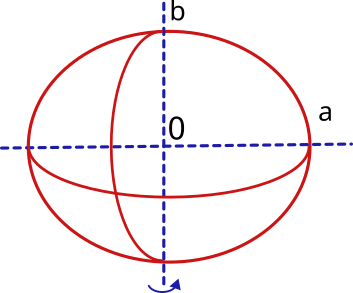
Therefore, to define the terrestrial ellipsoid it will be necessary to know its semi-major axis, which will correspond to the equatorial radius (at the equator) and its semi-minor axis, which will correspond to the polar radius (from center to north and south poles). In addition, it will be necessary to know the flattening index.
The ellipsoid model will serve as the basis for the horizontal coordinate reference systems.
Shape of the Earth, the geoid
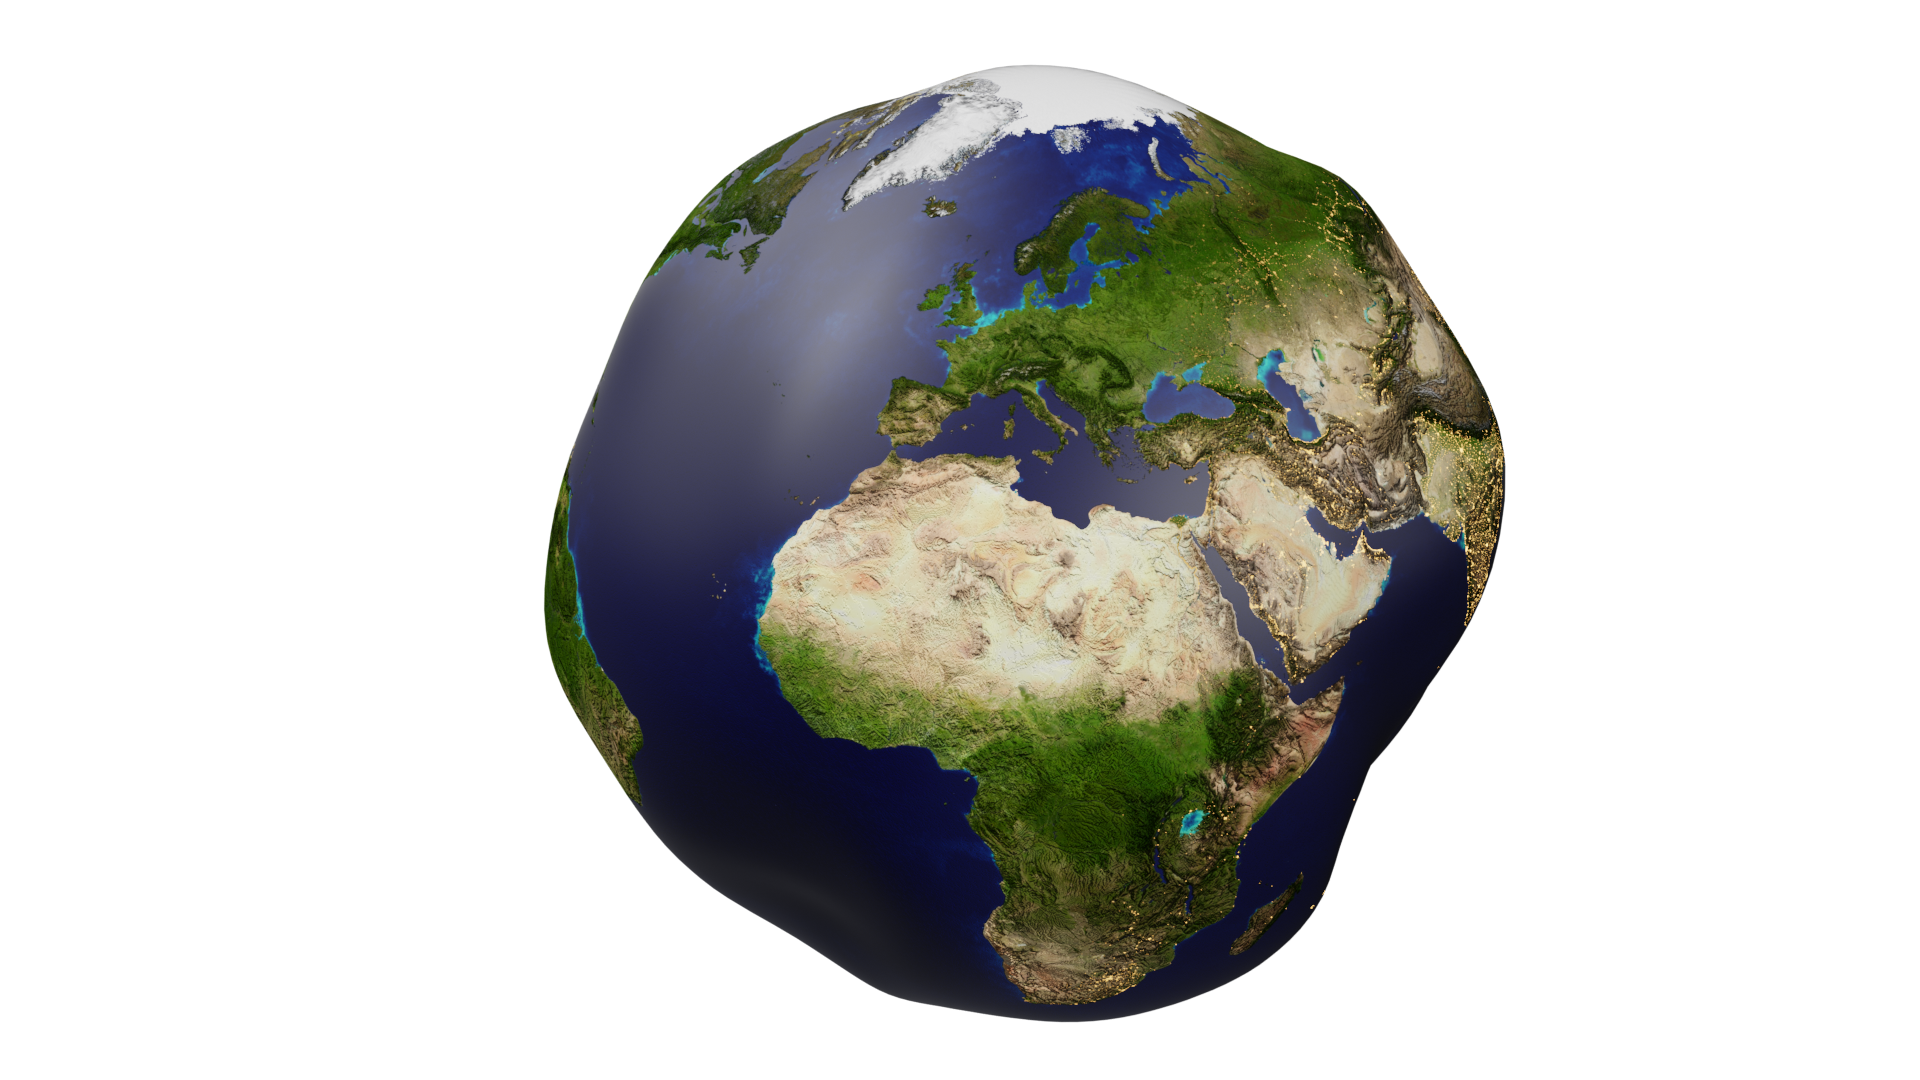
But from the geometrical point of view, the real shape of the Earth is not regular. Neither is the distribution of masses and materials in its interior. If we take as a reference the gravimetric potential of each point of the surface, we will obtain an irregular figure called geoid.
The geoid is a theoretical surface of equal potential (equipotential) of the earth's gravity field, which coincides approximately with the mean sea level and which joins all points that have the same gravity potential, i.e. that are attracted with the same gravitational intensity towards the center of the earth. The starting point is the mean ocean level and different techniques are used to obtain values of equal gravimetric potential in the emerged zones.
Relationship between ellipsoid and geoid. Ellipsoidal height, orthometric height and geoidal undulation
To define the geoid, its surface is compared with that of the regular ellipsoid, obtaining the difference for each point of the Earth. This information is usually stored in raster files.
The difference in height at any point between the height of the ellipsoid and the height of the geoid is known as the orthometric height and the variation between the geoid and the ellipsoid is known as the geoidal undulation.

h = vertical distance between the terrain point and the ellipsoid or ellipsoidal height
H = vertical distance between terrain point and the geoid or orthometric height
N = vertical distance between the geoid and the ellipsoid or geoidal undulation
If we said earlier that the ellipsoid would be the basis for the horizontal coordinate reference systems, the Geoid will be the basis for the vertical coordinate reference systems.
The positions calculated by GPS devices are of ellipsoidal type and the associated reference system, known as World Geodetic System WGS, refers to a global reference ellipsoid that was first established in 1960 and has been improved on subsequent occasions, the current version being WGS84, defined in 1984.
Recommended article: Horizontal and vertical coordinate systems. Datum
Power and energy in cycling. A practical calculation.
Power in cycling. Practical calculation
As we saw in the article "Energy, work and power", we can define power as the amount of work or energy use we perform in a given time. It is the speed at which we perform work or use energy.
Therefore, when referring to translational movements, power can be expressed as the product of force multiplied by velocity. In rotational movements we can consider an "instantaneous power" at each pivot point that can be defined as the product of the momentum or torque of the force multiplied by the angular velocity (angle rotated in the unit of time). The angular velocity is equivalent to the pedaling cadence expressed in angle values per second.
Power(w) = Torque (Nm) x Cadence (rad/seg)
The equivalence between revolutions per minute, radians per second and sexagesimal degrees per second is: 1
rpm = 2·PI/60 rad/sec = 360/60 º/sec
Recommended article: Energy, Work and Power, some physical definitions
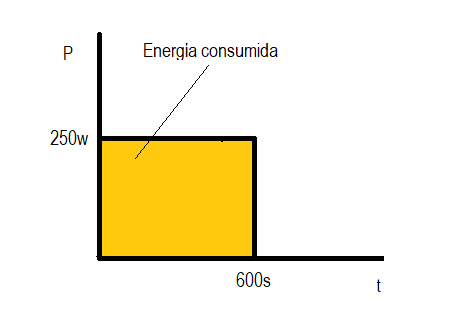
Energy consumed (Kj): From a graphical point of view, the energy consumed when performing an effort at a certain power corresponds to the area under the power curve. If we refer to the power developed while cycling, running or walking along a route, the total energy consumed would be the total area under the power curve developed along the route.
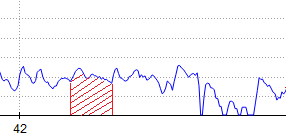
Energy calculation
Example: If we have a cyclist performing a fixed effort of 250 watts for 10 minutes (600 seconds). The entire area under that curve (which is a horizontal line in this case) is the energy expended to produce that power.
Power = (work or energy) / time
clearing up energy in this formula,
Energy = Power x time
and replacing the values,
Energy = 250w x 600 s = 21600 joule = 216 kj
In this case it is evident the coincidence with the area of the rectangle of base time (600 sec) and height power (250 w) because being a constant power its graph is a horizontal line.
Energy, Work and Power in physics.
Energy, Work and Power, some physical definitions
Energy, Work and Power are closely related physical quantities.
Energy
Energy is the capacity of a system to produce work. A system that has a certain energy will not do any work until that capacity is converted into motion. For example, an apple on a tree has a potential energy, but it does not do any work until it falls.
Its unit in the international system is the Joule (joule) which is the work done by a force of one newton whose point of application is displaced by one meter in the same direction.
Work
Work consists of a transfer of energy between systems. In the case of a force acting on a body, its work is equivalent to the energy required to move it. A force acting on a body is then said to do work when it causes a displacement of the body in the direction of the force. Therefore, in a mechanical system, if there is no displacement, the work is zero. This conclusion is not valid for thermodynamic systems, where heat transfers are considered as energy transfers.
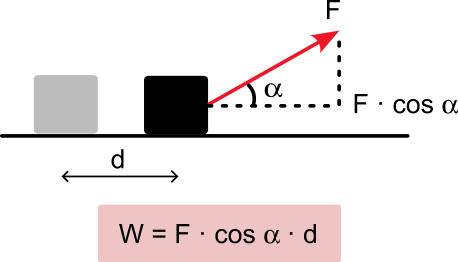
Work has the same units as energy.
Power
we can define power as the amount of work or energy use we perform in a given time. It is the speed at which we perform work or use energy.Units: watts.One watt of power is generated when work is done that consumes 1 Joule of energy during 1 second of time.. 1 w = 1 joule/ 1 segundo

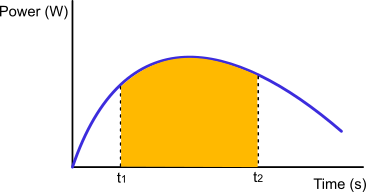
Graphical interpretation of energy in the power chart
Graphically, energy is the area under the graph of power as a function of time:
Null Island. Station 13010. The origin of coordinates. Zero Point.
Null Island. Station 13010. The origin of coordinates. Zero Point
At the intersection between the equator and the Greenwich meridian are the coordinates 0ºN, 0ºE. This geographical point is located in the Gulf of Guinea in the Atlantic Ocean and what is in that position, anchored at those coordinates, is a meteorological buoy called "Soul bouy" or station 13010, which is part of the network of buoys "Prediction and Research Moored Array in the Tropical Atlantic" (PIRATA), dedicated to collect meteorological and oceanographic data to study ocean-atmosphere interactions in the tropical Atlantic.
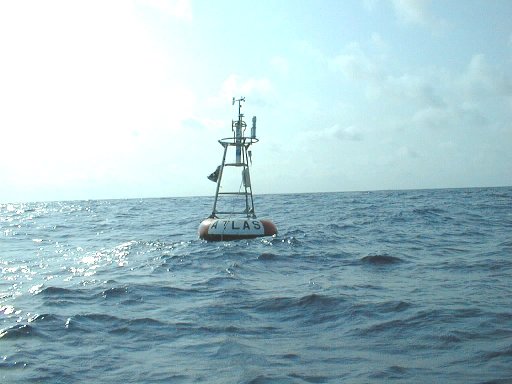
"Null Island" is the fictitious name of a non-existent island located at these coordinates that gave rise at the time to multiple jokes, including the existence of a website of the Republic of Null Island, whose domain "nullisland.com" is for sale today.
Forces when walking or running. Physics in walking and running.
Forces when walking or running
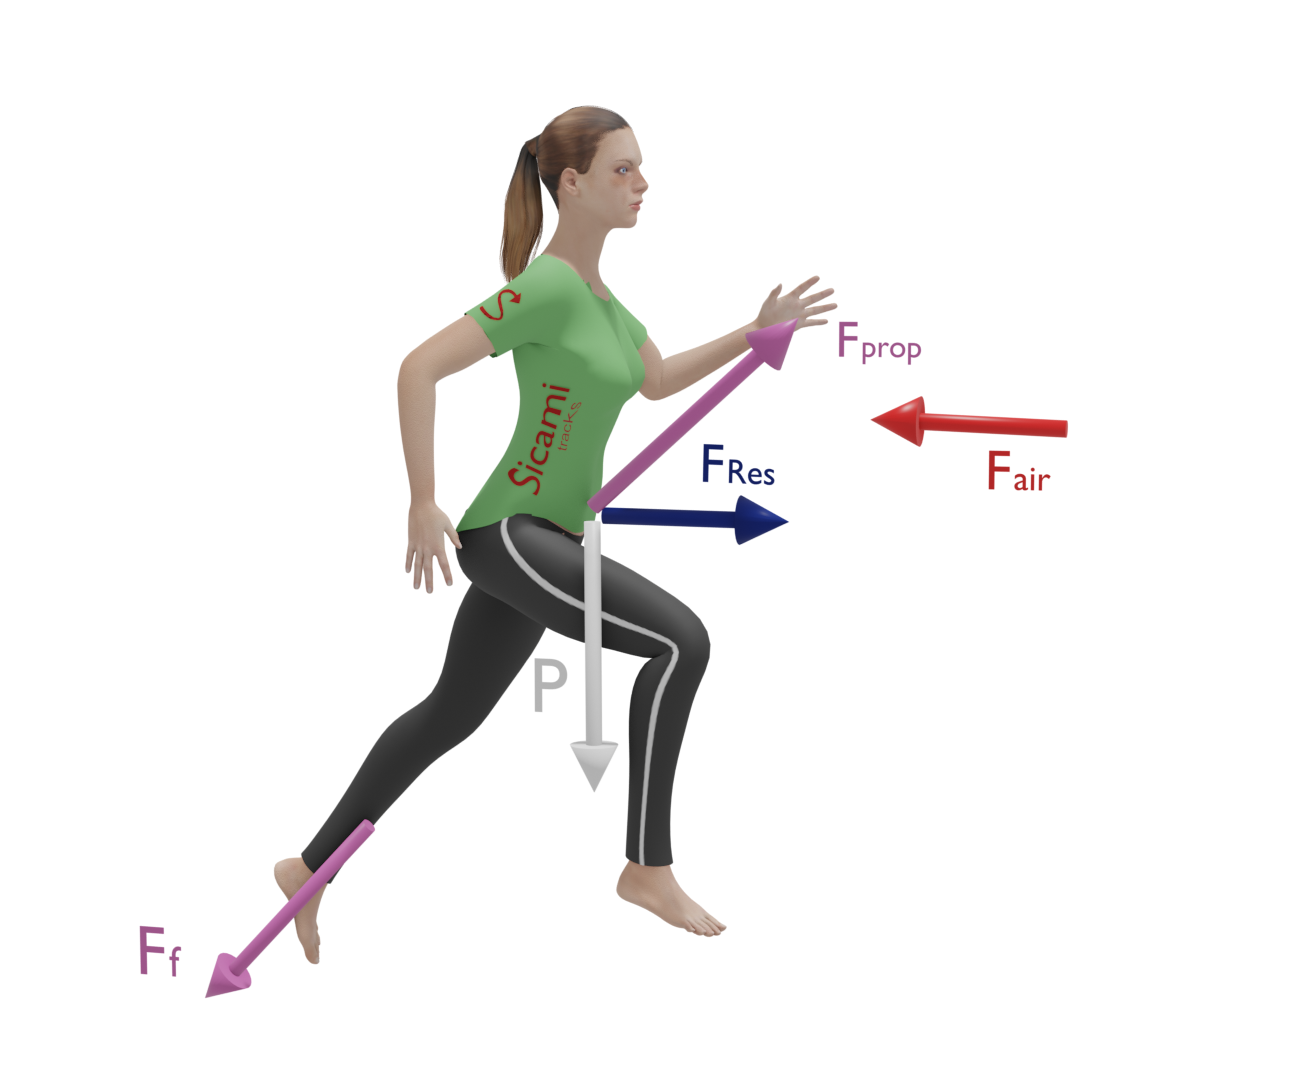
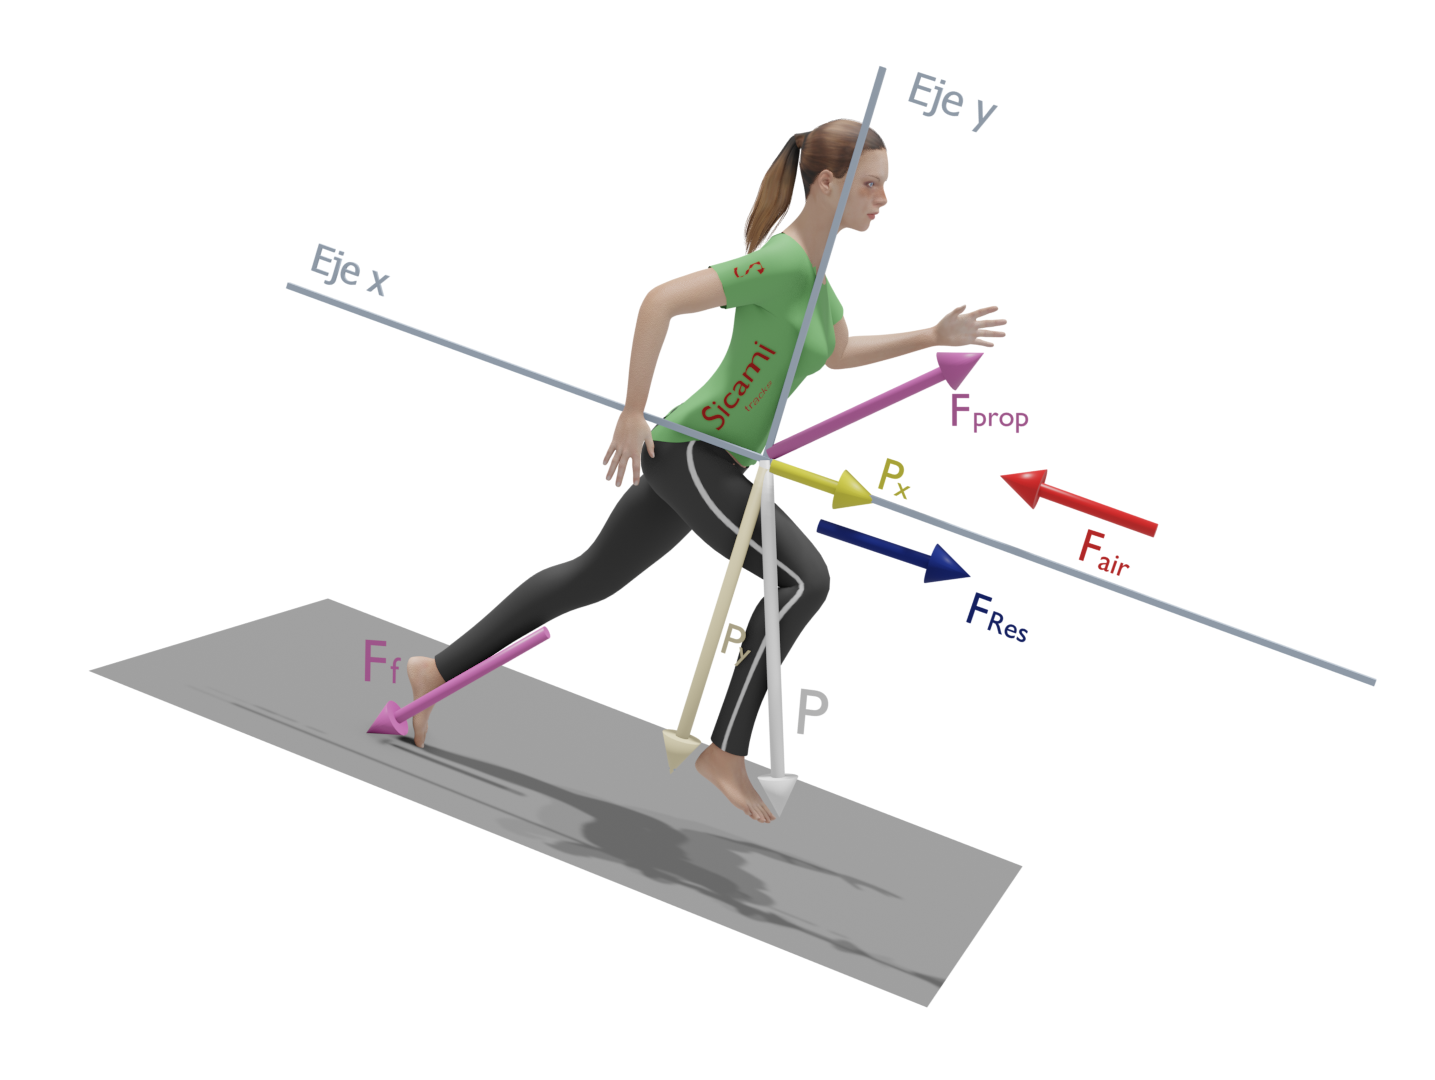
When running or walking there are many forces at work, the most important of which, for the purpose of producing displacement, is the propulsive force exerted by the foot on the ground.
This force has an inclined direction, depending on the angle of the foot strike, and can be broken down into two components in the forward direction, ‘x’, and perpendicular to the ground, ‘y’.
The ‘x’ component is the one that will allow the runner or walker to move forward causing an acceleration in the forward direction. This component will be horizontal when moving on flat ground.
The ‘y’ component is what will allow the runner to overcome gravity and move upwards causing a force in a direction perpendicular to the ground.
Essentially running consists of consecutive parabolic movements in which the runner pushes off the ground to reach a certain maximum height and lands again some distance in front. Consequently, his movement can be divided into two movements, a jumping movement and a forward movement, and the final result will be the consequence of overcoming the different forces that will oppose these movements.
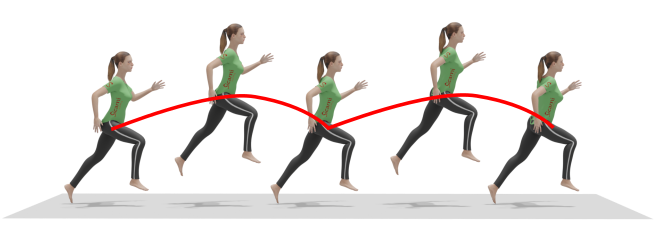
The propulsive force is obtained by applying force with the foot on the ground, with which there must be sufficient frictional force. The ground reaction force (Newton's third law) provides the necessary propulsion. In other words, when we run we exert a force opposite to the direction of motion and according to Newton's third law, the ground exerts a force on us equal and opposite to our force on the ground, which allows forward motion.
If there were no frictional force, it would be impossible to move, just imagine what happens when you try to run on a frictionless surface (e.g. ice). If there were no static friction, the foot would push backwards on the surface and simply slide backwards.
Let's take a closer look at some particular cases.
Running on the flat
In this case, the main forces opposing displacement are the gravitational force, caused by our own weight, and the aerodynamic drag force caused by the air.
For the forward movement on the flat, the runner must apply a force on the ground that is greater than the sum of the force of gravity and the aerodynamic drag force.
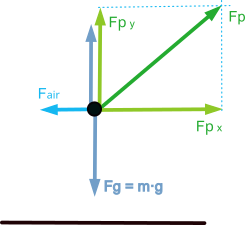
In a simplified scheme it would look like the following figure, where the propulsion force ‘Fp’ has been broken down into a vertical component ‘Fpy’ that must overcome the force of gravity and a horizontal component ‘Fpx’ that must overcome the aerodynamic drag and provide the acceleration.
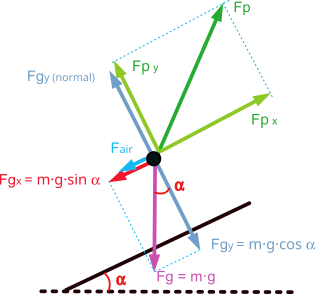
Running uphill
In this scenario an ‘x’ component of the gravitational force appears in the direction of the displacement and in the opposite direction to it. On the other hand, we will observe a reduction in the value of the frictional force.
Although the y-component (perpendicular to the ground) of the gravitational force decreases with the slope of the terrain, it is not sufficient to compensate for the increase in the x-component and the loss of friction with the ground.
Therefore, the force to be applied must be greater than the sum of the force of gravity at ‘x’, the force of gravity at ‘y’ and the aerodynamic drag force.
From an energy point of view, the upward stroke not only involves a change in kinetic energy, but also a net increase in potential energy.
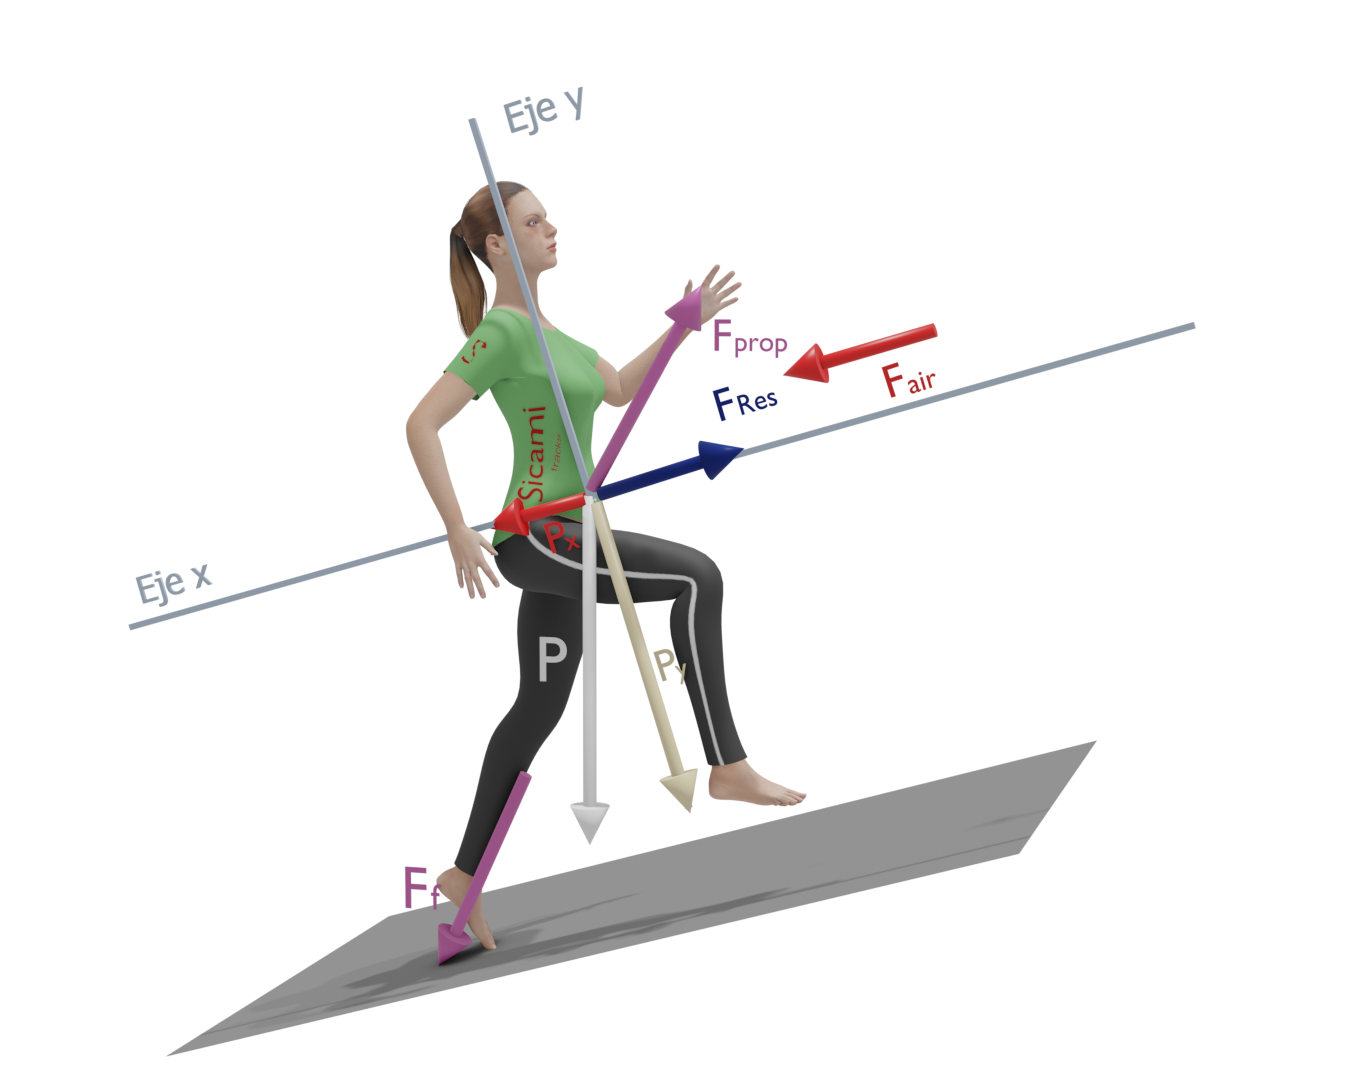
In a simplified scheme it would be as shown in the following figure, where the propulsion force ‘Fp’ has been broken down into a component perpendicular to the ground ‘Fpy’ that must overcome the force of gravity and another one parallel to the ground ‘Fpx’ that must overcome the aerodynamic drag, the ‘x’ component of the gravitational force and, in addition, provide the acceleration.
Running downhill
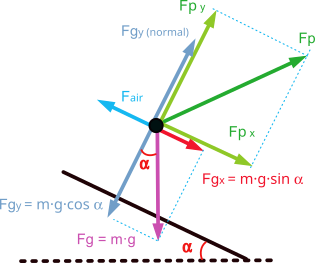
In this case the ‘x’ component of the gravity force will be favourable to the displacement and the forces to be overcome will be the ‘y’ component of gravity and the aerodynamic drag force.
In a simplified scheme it would be as shown in the following figure, where the propulsive force ‘Fp’ has been broken down into a component perpendicular to the ground ‘Fpy’ and another parallel to the ground ‘Fpx’ that must overcome the aerodynamic drag in addition to providing the acceleration.
The ‘x’ component of the gravitational force has the same direction and sense as the displacement, so the effort to move forward will be less in this case.
Physics of cycling: Forces. Basic notions
Forces on the cyclist and the bicycle. Basic notions
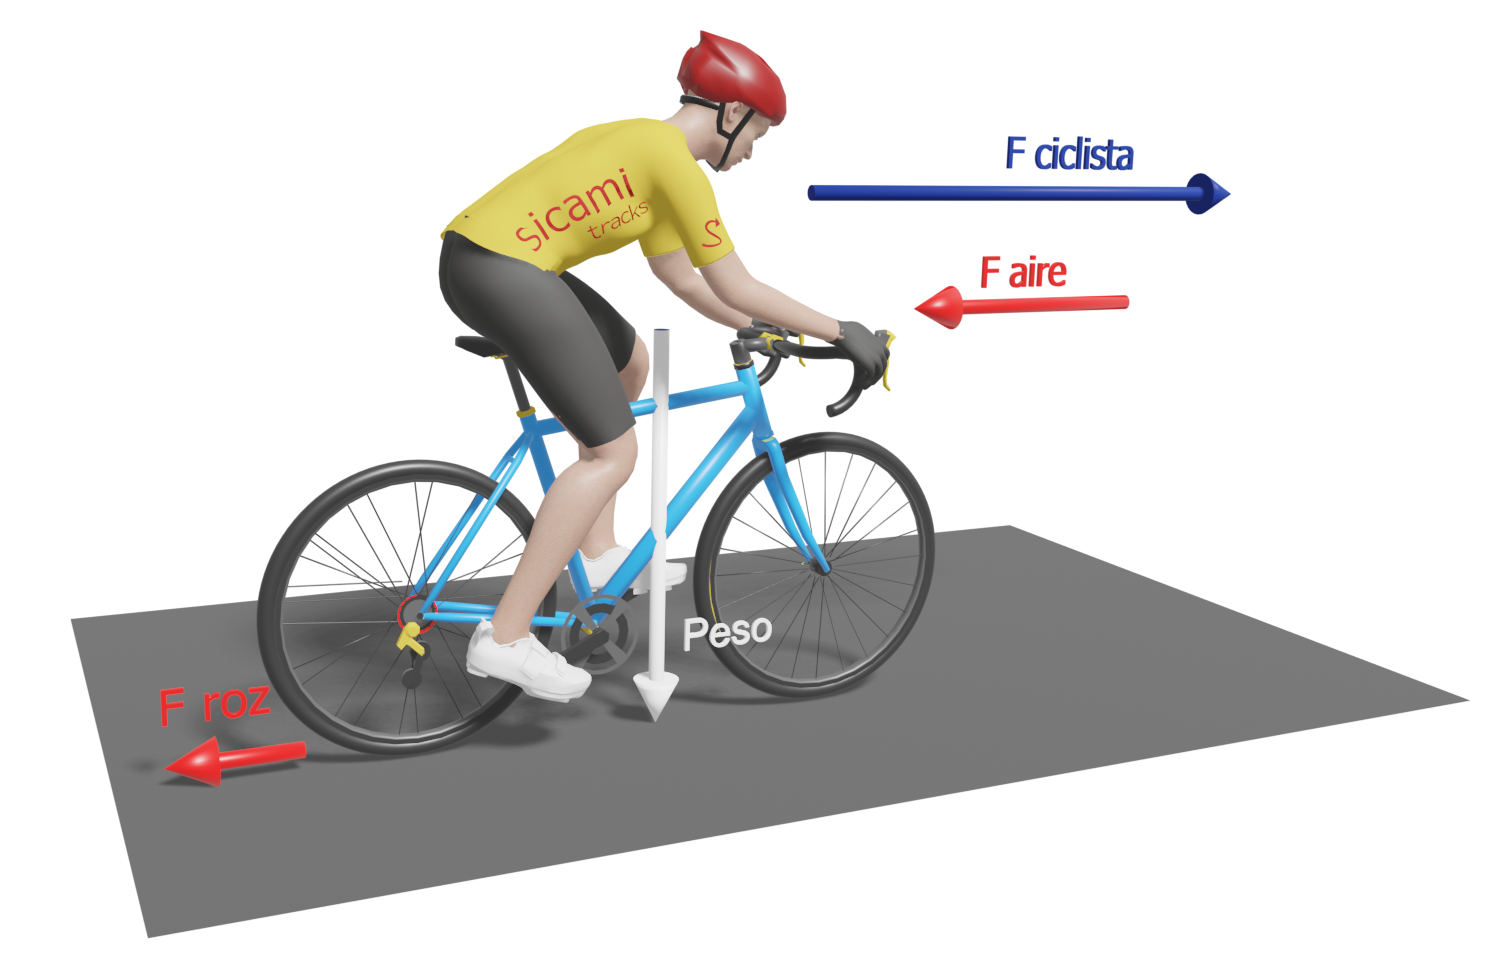
When we ride a bicycle, various forces act on us. If we focus on forward motion, the most significant ones for reaching and maintaining a certain speed are the following.
- Air resistance or aerodynamic drag
- Rolling resistance (friction of the wheels on the ground)
- Gravitational pull force (due to the weight of the bicycle-cyclist combination)
- Acceleration force (only when there is a change of speed, it does not exist at constant speed).
- Marginal forces: Friction of the chain, gears and bearings, bending losses of the frame, etc.
These are the five main forces that must be overcome to reach and maintain a certain speed. The marginal forces are not considered in the following, but are minimised by correct maintenance and lubrication. The final state of the movement will depend on the difference between the forces in the direction of displacement and the forces in the opposite direction of displacement.
Cyclist riding on the flat
##publi##
Cyclist ascending
When pedalling uphill, aerodynamic resistance becomes less important in favour of the force of gravity, which is determined by the weight of the cyclist-bicycle combination.
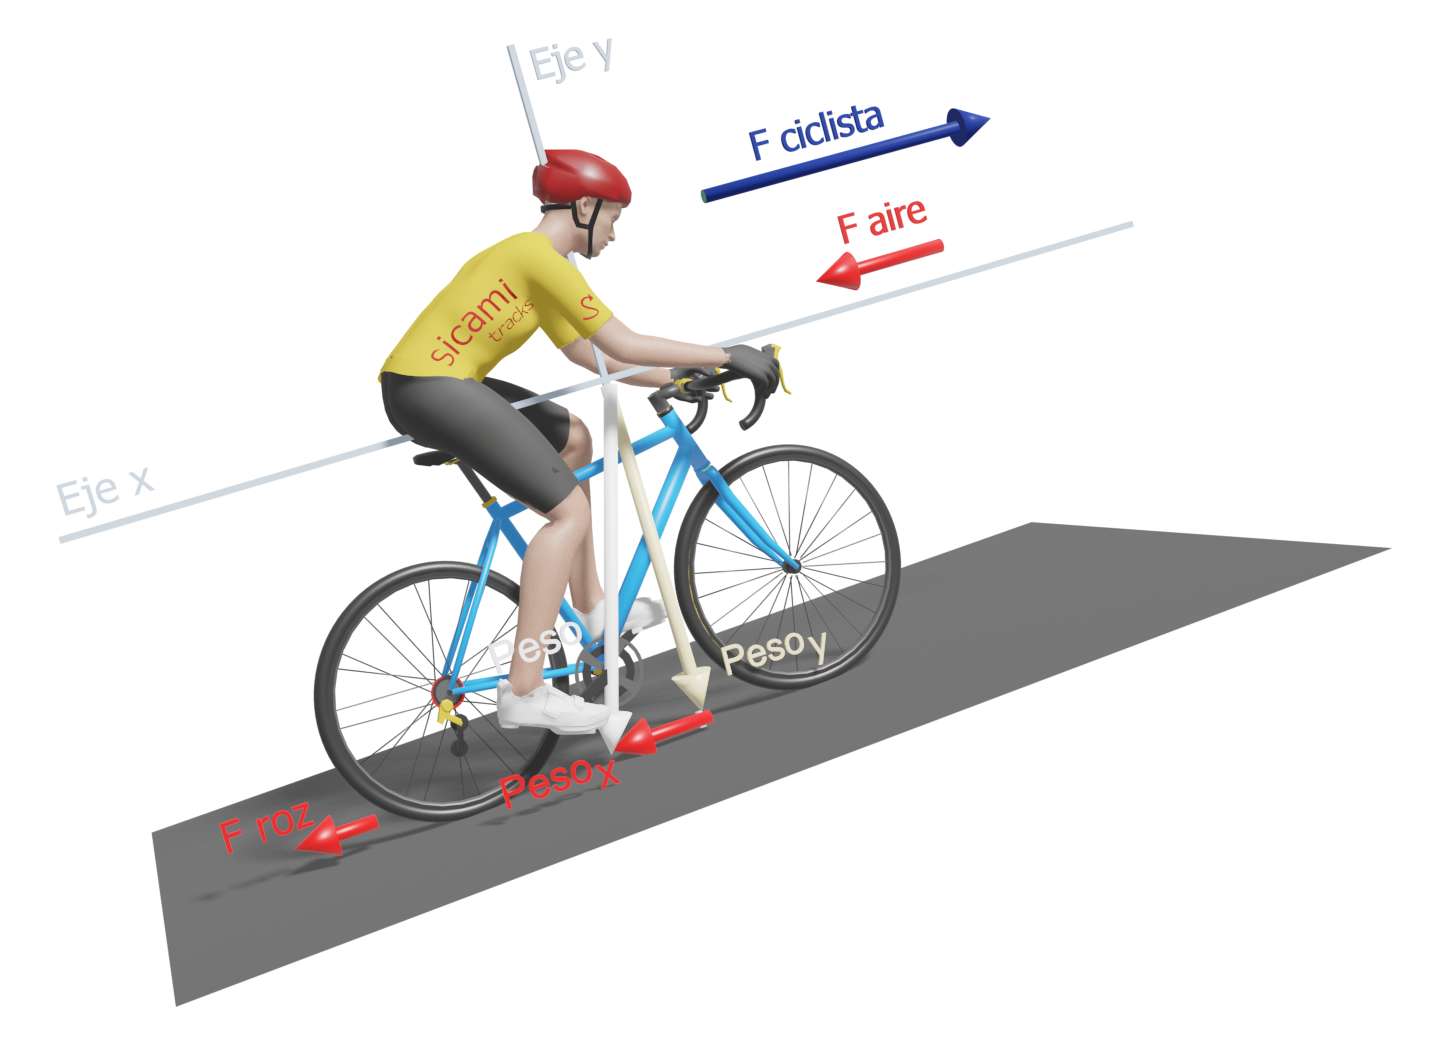
But not all of our weight will oppose the forward movement. To see this more clearly, we can set up a coordinate system with the x-axis parallel to the ground and the y-axis perpendicular. The total weight will point towards the centre of the earth, but we can break it down into two components according to each of the established coordinate axes. Thus we will obtain a component on the y-axis, "y-weight" (perpendicular to the ground) and another on the x-axis, "x-weight" (parallel to the ground). This last component parallel to the ground is the part of our weight that actually opposes our upward movement.
Cyclist descending
In the case of descents, the "x-weight" component will point in the direction of movement and will therefore be added to the weight we exert when pedalling, facilitating forward movement. The steeper the slope of the descent, the greater the value of "x-weight". We will be able to stop pedalling when this force exceeds the value of the sum of the forces opposite to the direction of movement.
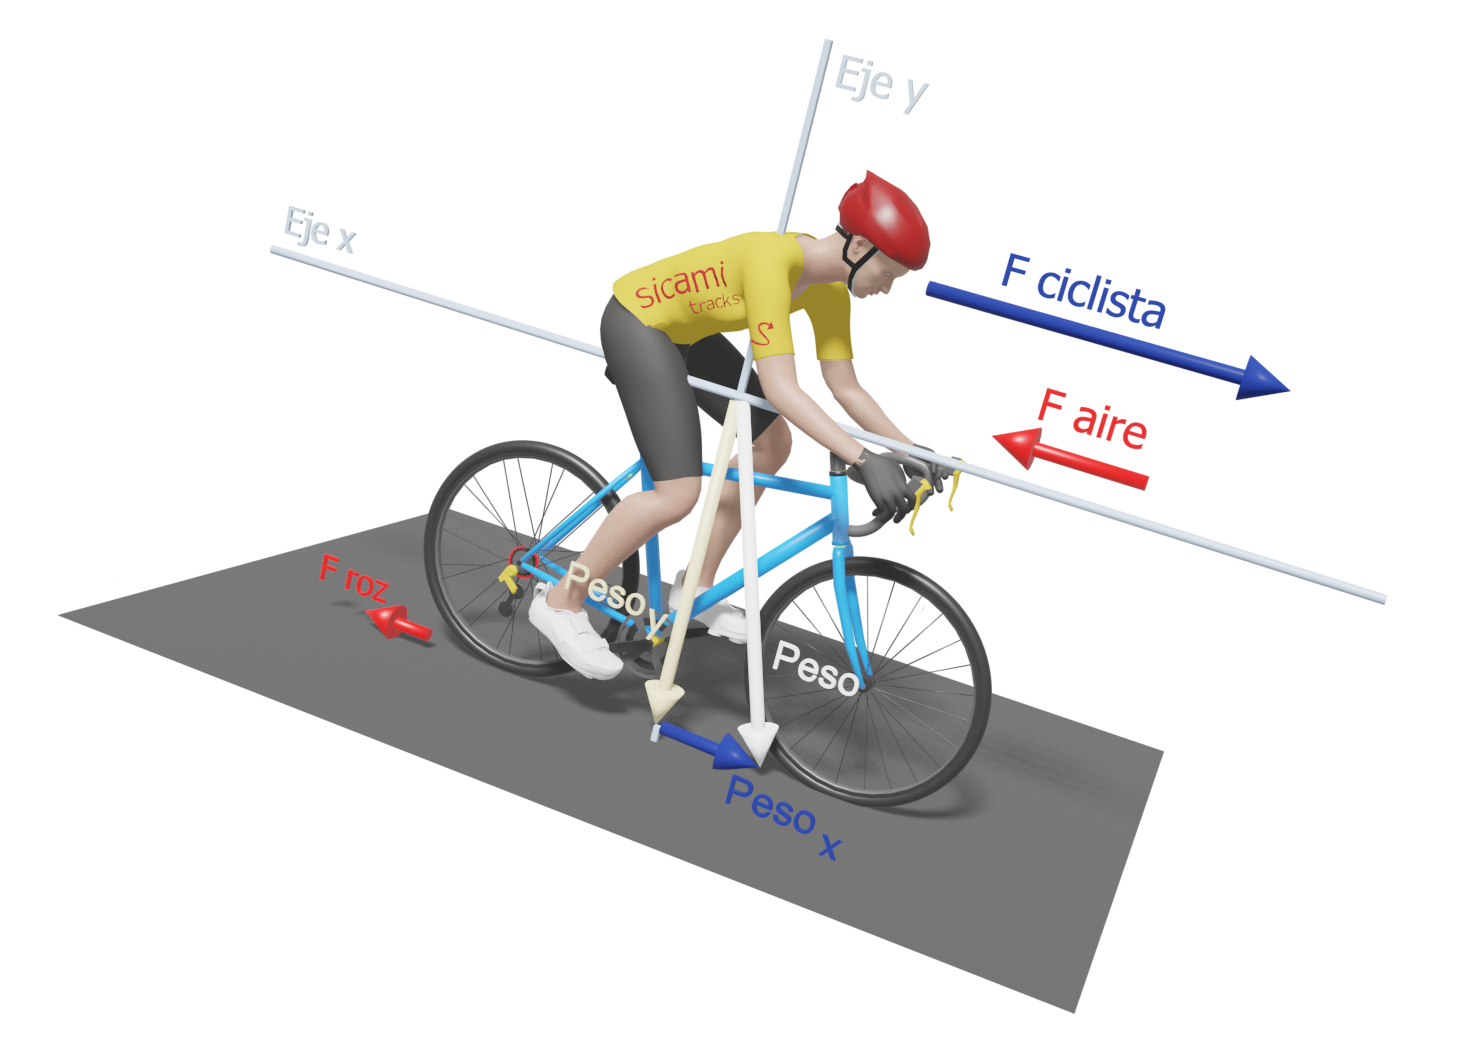
In future articles we will expand and deepen all these concepts.
Orientation methods. Orientation with a watch.
Orientation methods. Orientation by watch.
First of all, it is essential that the watch is on solar time or that we carry out the process by mentally setting the hour hand to the corresponding solar time. The official time will depend on the country and the season of the year and usually varies by one or two hours from solar time.
This method is not applicable in the area between the tropics as the result will vary according to the time of year and at certain times the position of the sun will be practically vertical, casting no shadows. Something similar occurs in summer in the central hours of the day and the closer to the tropics.
If we are in the northern hemisphere
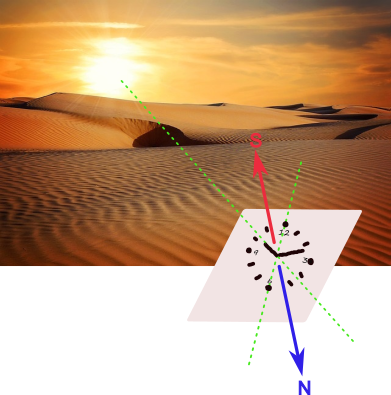
If we are in the northern hemisphere, we will proceed as follows: we will keep the watch in a horizontal position, we will point the hour hand at the sun. Next we will imagine a line that passes through 12 and 6 o'clock. The bisector of the angle that the hour hand forms with that 12-6 line will indicate south. Remember that the bisector of an angle is the line that divides that angle into two equal parts.
In the opposite direction you will find the north. To find the east and west we will position ourselves facing north, to our right will be the east and to our left the west.
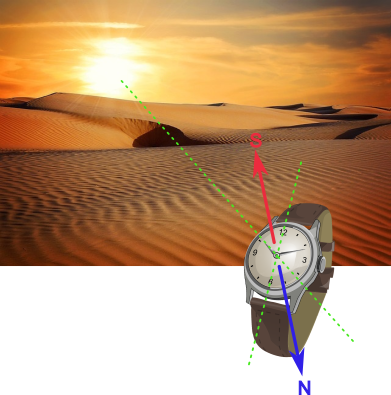
If we are in the southern hemisphere
If we are in the southern hemisphere, we should point to the sun with the number 12, instead of the hour hand, and in this case the bisector of the angle formed by the line 12-6 with the hour hand will mark the north.
South will be in the opposite direction.
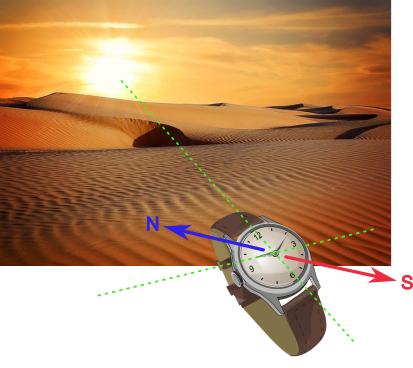
If we don't have a needle clock
If you don't have a clock with needle but you know the time, you can always draw it on a piece of paper, on the ground or using twigs.
Physics. Newton's laws of motion.
Newton's laws of motion
These three laws are the following
- First law or law of inertia.
- Second law or fundamental law of dynamics.
- Third law or principle of action and reaction.
Newton's First Law: Law of Inertia
The first law or law of inertia postulates that a body at rest or moving in a straight line with a constant velocity will remain in that state unless an external force is applied.
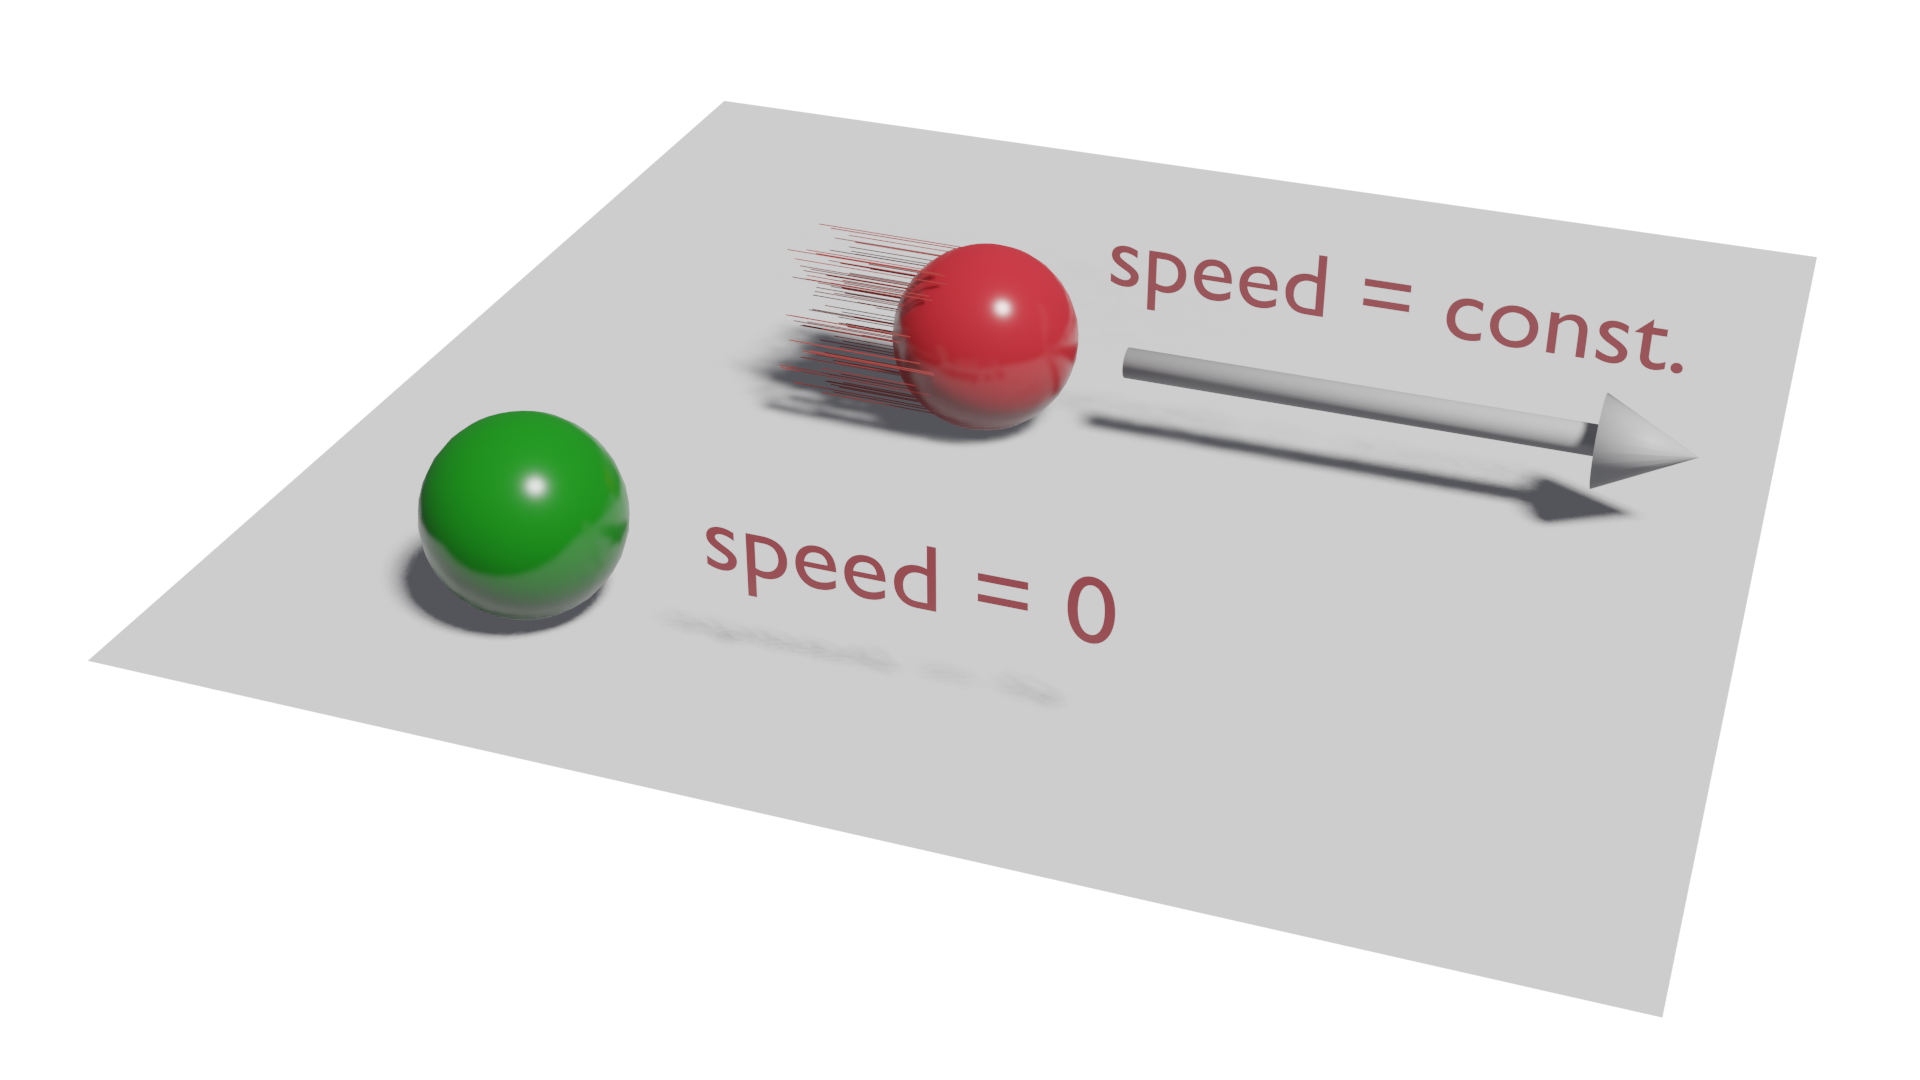
This principle had already been observed earlier by Galileo Galilei.
We are quite familiar with the effects of this law because we perceive them daily, for example, when we travel in a vehicle that brakes we notice how our body tends to continue at the speed at which we were traveling or when it takes a curve it tends to continue in a straight line. It is also responsible for falls when we stumble while walking, running or pedaling.
Newton's second law: fundamental law of dynamics
m = mass of the body in kg.
a = acceleration in m/s2 (meter per second squared).
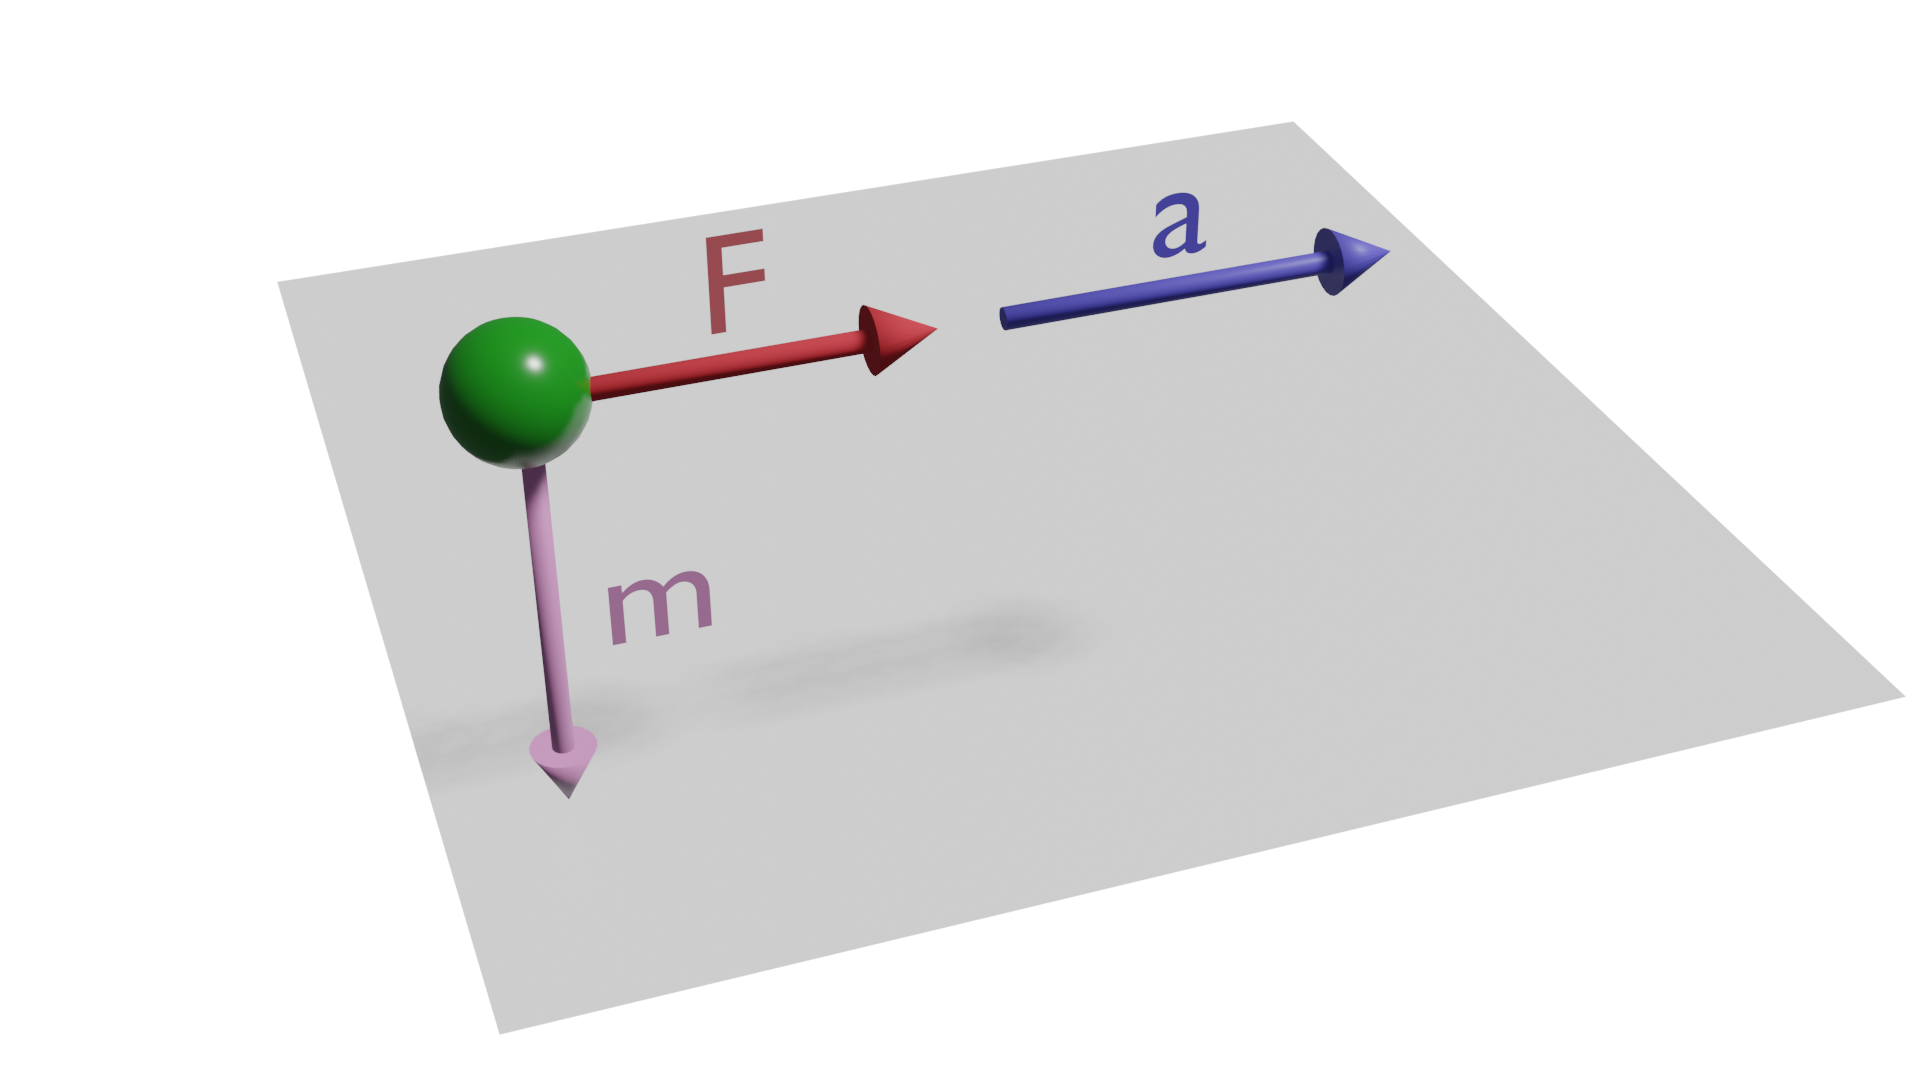
That is, the greater the force applied to a body, the greater its acceleration and, on the other hand, the greater the mass of a body, the greater the force required to accelerate it.
Newton's third law: action and reaction principle
Newton's third law or principle of action and reaction states that every action in one direction generates a reaction of the same intensity, but in the opposite direction.
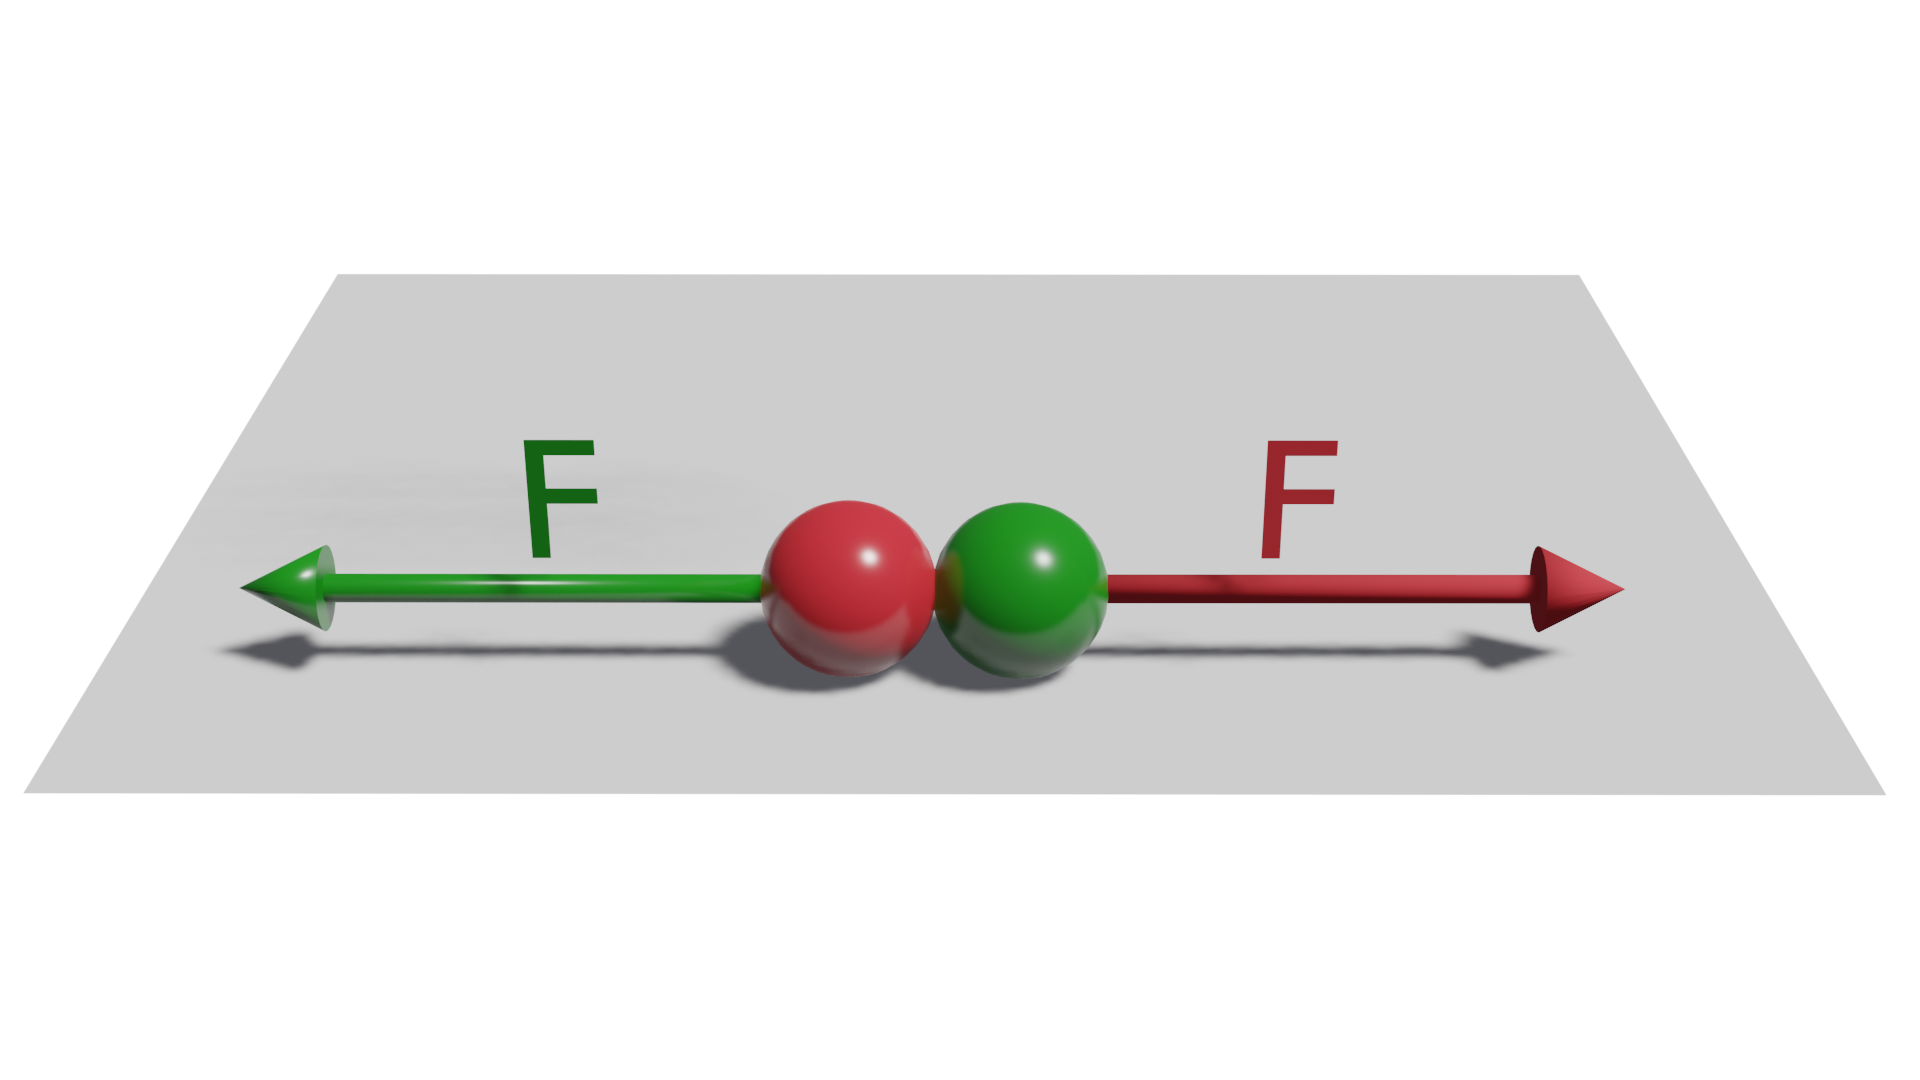
With the effects of this law we are also quite familiar in our daily life, for example, when we move any heavy object by pushing it, i.e. applying force on the object to move it, we perceive a resistance of the object which is the reaction force of this object on us.
The Law of Universal Gravitation or Law of Gravity
The law of Universal Gravitation or law of gravity
This law describes how two bodies with mass interact and attract each other, and states that the intensity of the force of attraction between these two bodies is proportional to the product of their masses and inversely proportional to the distance between them squared.
In other words, the stronger the mass of the bodies and the closer they are to each other, the stronger the force of attraction will be, and the stronger the force of attraction will be, decreasing with distance.
The formula is as follows:

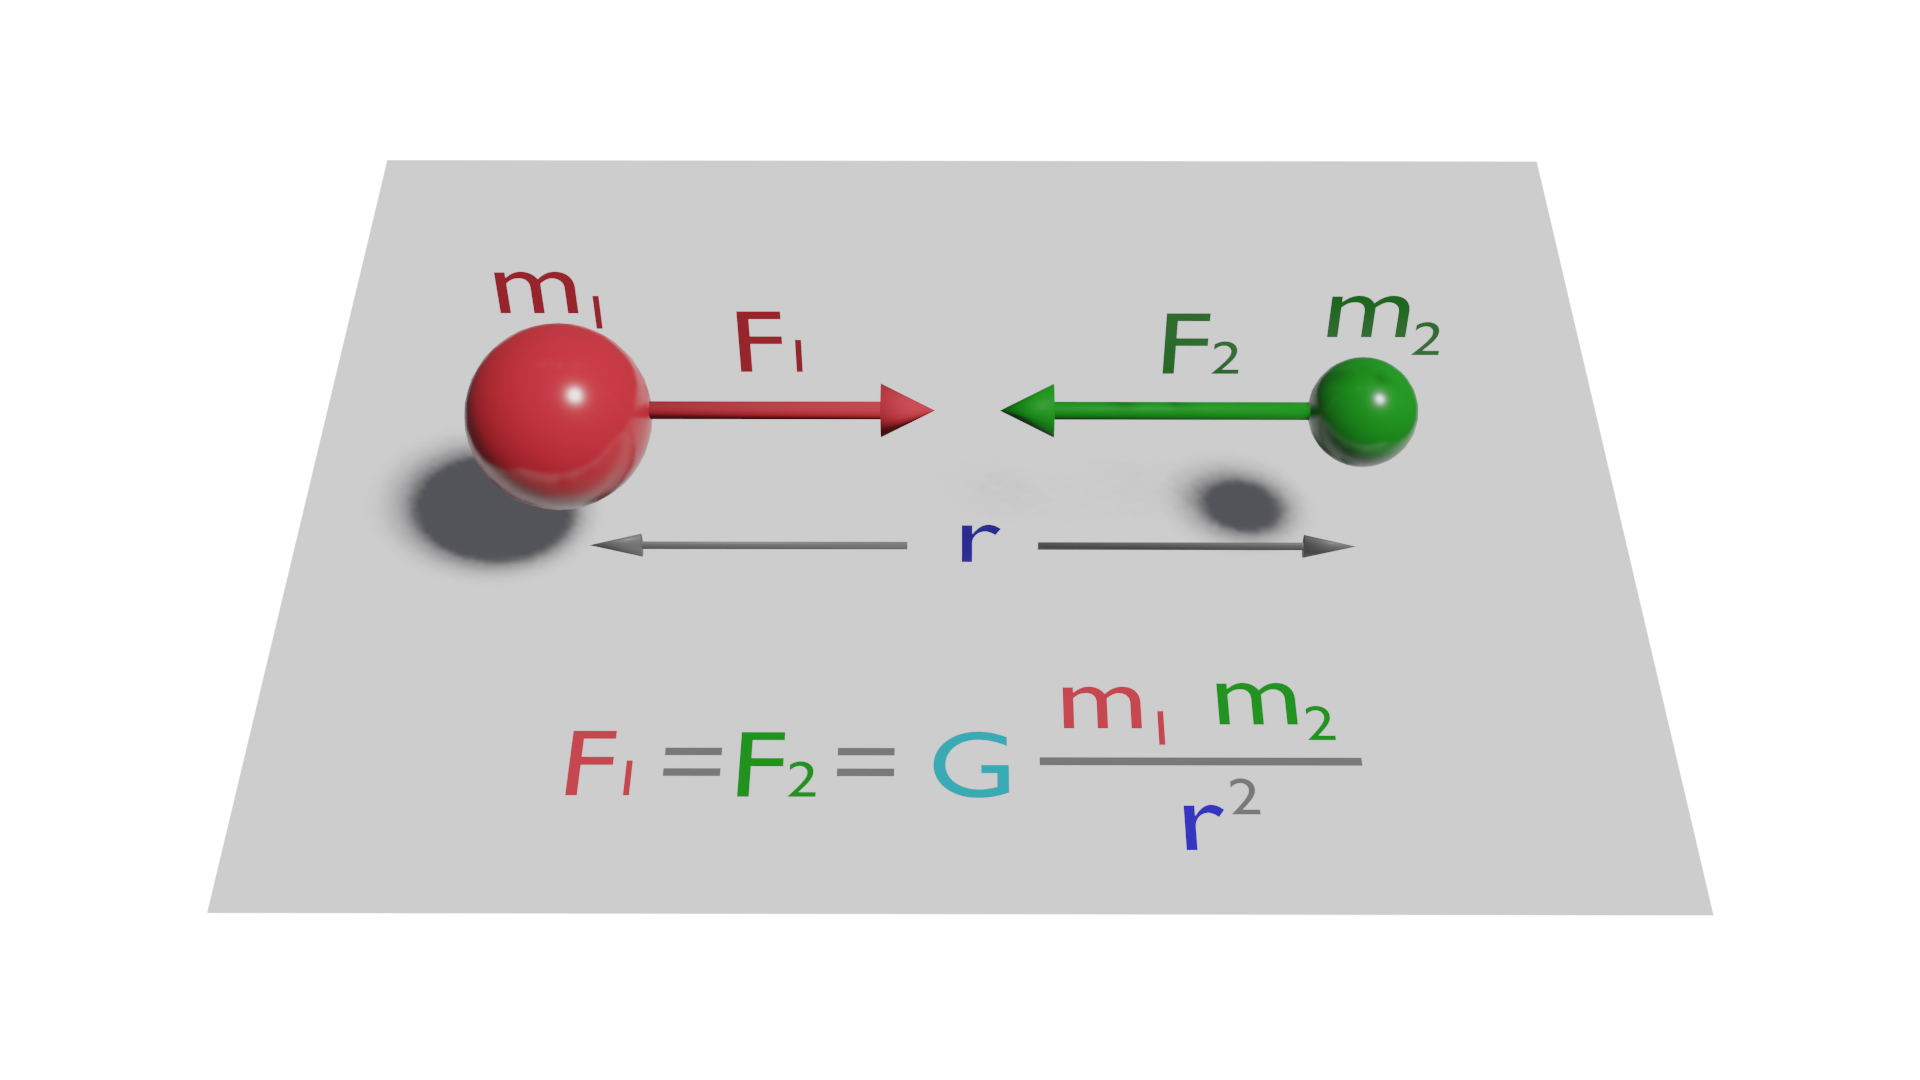
Where::
F is the value of the force exerted between the two bodies along the line joining them.
m1 is the mass of the body 1
m2 is the mass of the body 2
r distance between the centres of mass of the two bodies
G is a constant, the universal gravitation constant, and its value is
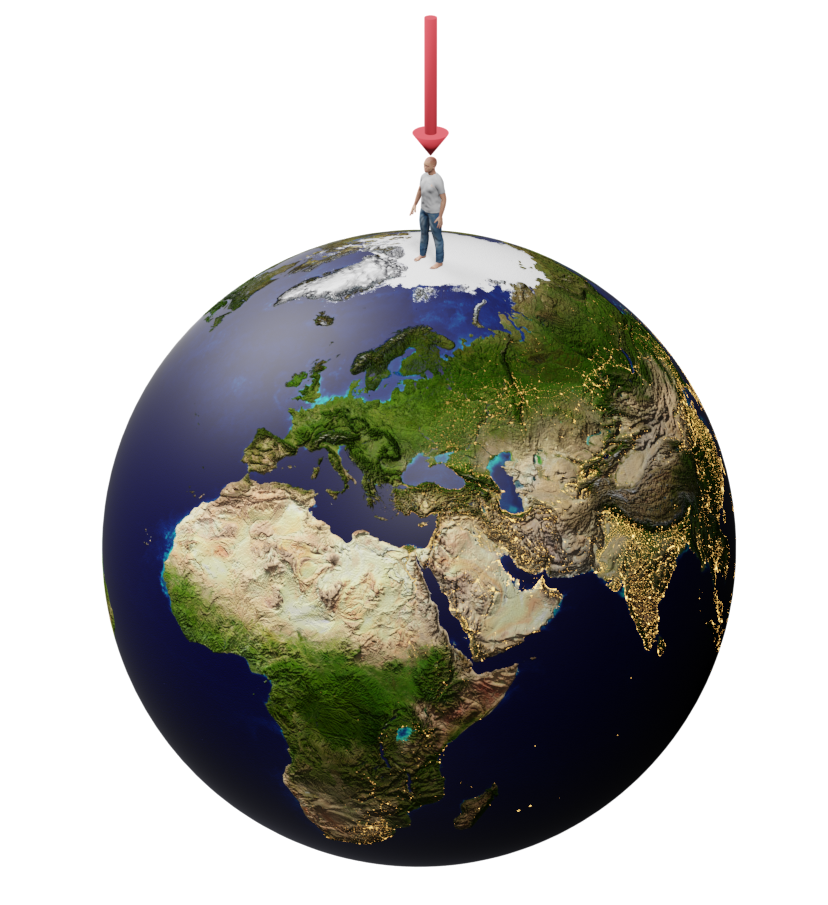
Calculate the force with which the Earth attracts you
If you want to know how strongly the earth attracts you, you need to know your mass in kilograms, the mass of the earth and its radius, which is the distance that separates you from the centre of mass of the planet.
If your weight is 75 kilos:
Approximate mass of the Earth: 5.98 × 10^24 kg
Average radius of the Earth: 6.37 km = 6,370,000 metres
Forces on the pedal. Torque.
Torque of force on the pedal
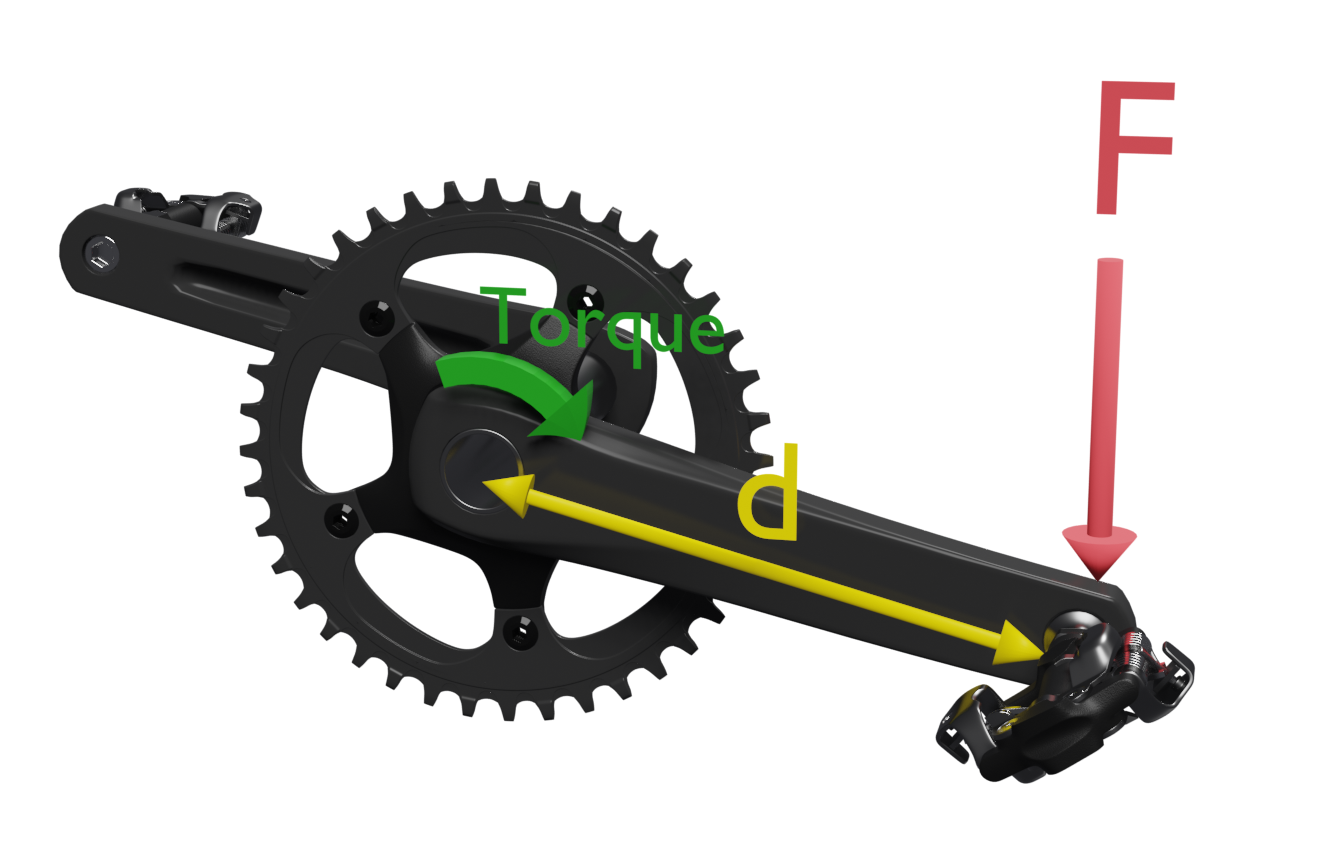
When pedaling our force is applied to the pedal and transmitted to the axle through the crank, which acts as a lever. The application of the force will cause a rotation with which we will observe a "torque" or "torque".We can define torque as the ability of a force to rotate an object when applied to it.
The value of the torque of a force can be calculated as the product of the value of the force applied at a point, multiplied by the distance from that point to the torque axis. Its unit is the newton per meter.
T = F · d
F = force on the pedald = distance to the center of rotation (distance pedal axis - crank axis)
Tangential and radial components of pedal force
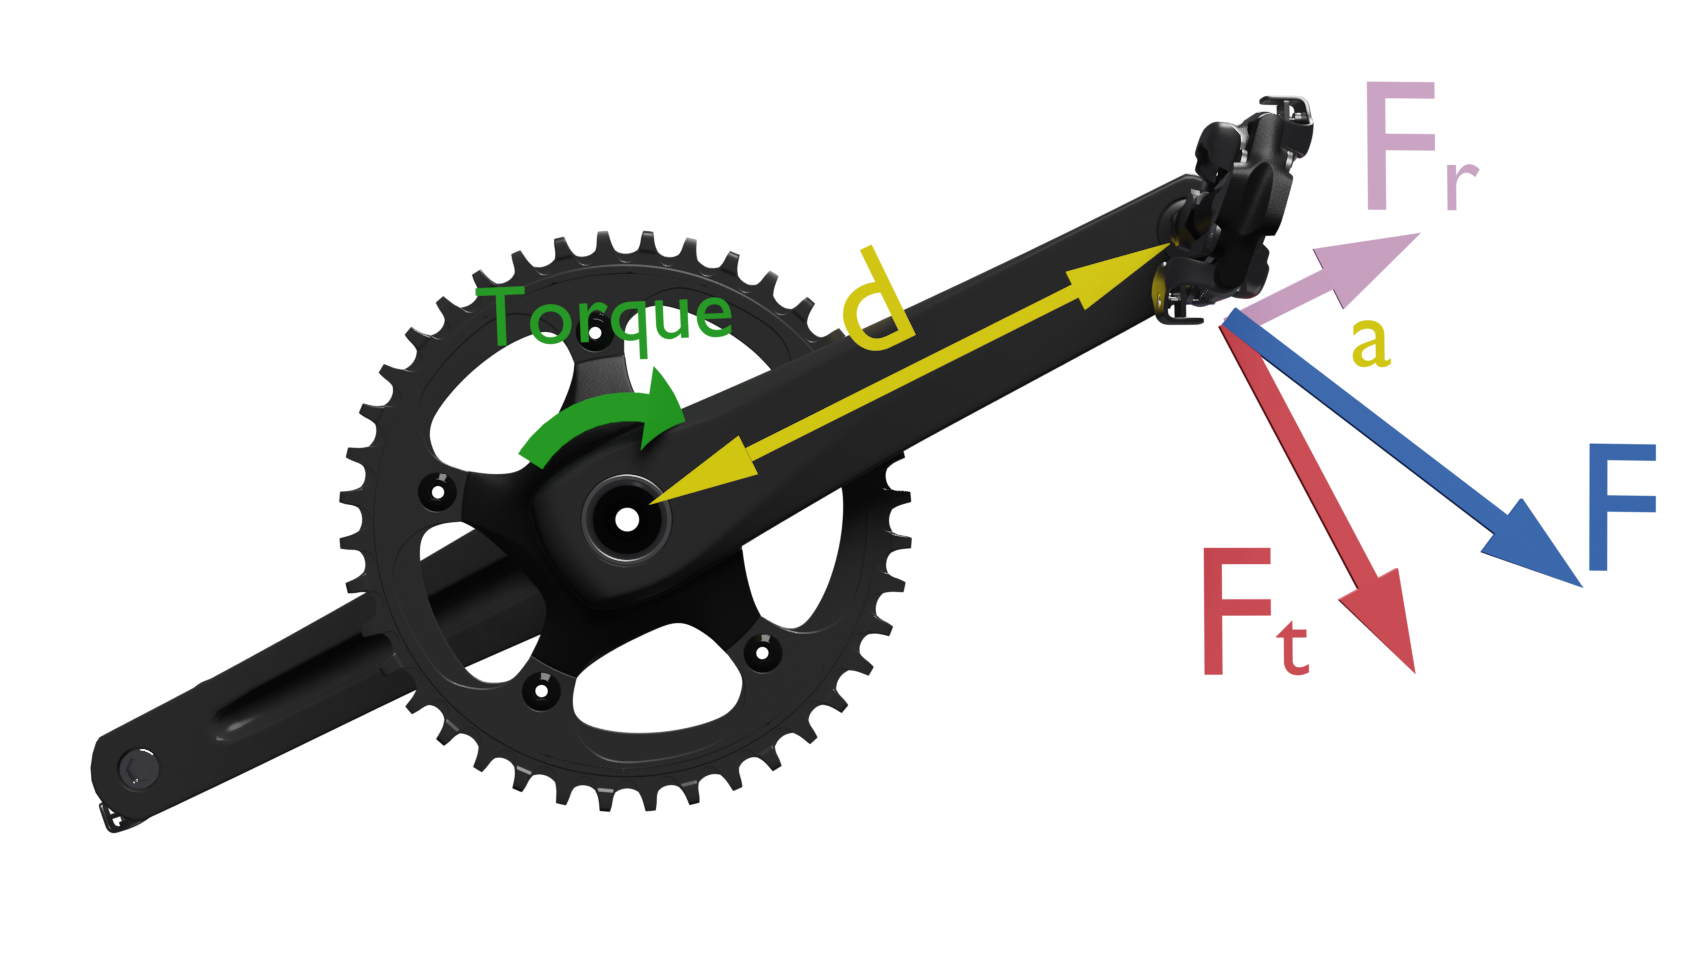
But this would only be valid for forces applied perpendicular to the distance. Since the force can be applied at different angles, depending on the thrust position, we will extend the formula as follows:
T = F · d · sen (a)
Where a is the angle of application of the force with respect to the line joining the point of application and the center of rotation. The angle whose value is less than 90º will always be taken. This is equivalent to decomposing the force exerted on the pedal into two components:
• a tangential component Ft, which is tangent to the circumference drawn by the pedal Ft = F sin (a)• a radial component, Fr in the direction of the connecting rod. Fr = F cos (a)
The tangential component will always be perpendicular to the connecting rod and is the one that produces useful torque. The radial component Fr will only compress or stretch the connecting rod.
Pedalling efficiency and effectiveness
Assuming that we pedal pushing down vertically, if the crank is also in a vertical position at "12-6 o'clock", the Ft component perpendicular to the distance line will be zero and the applied force will not cause any rotation.
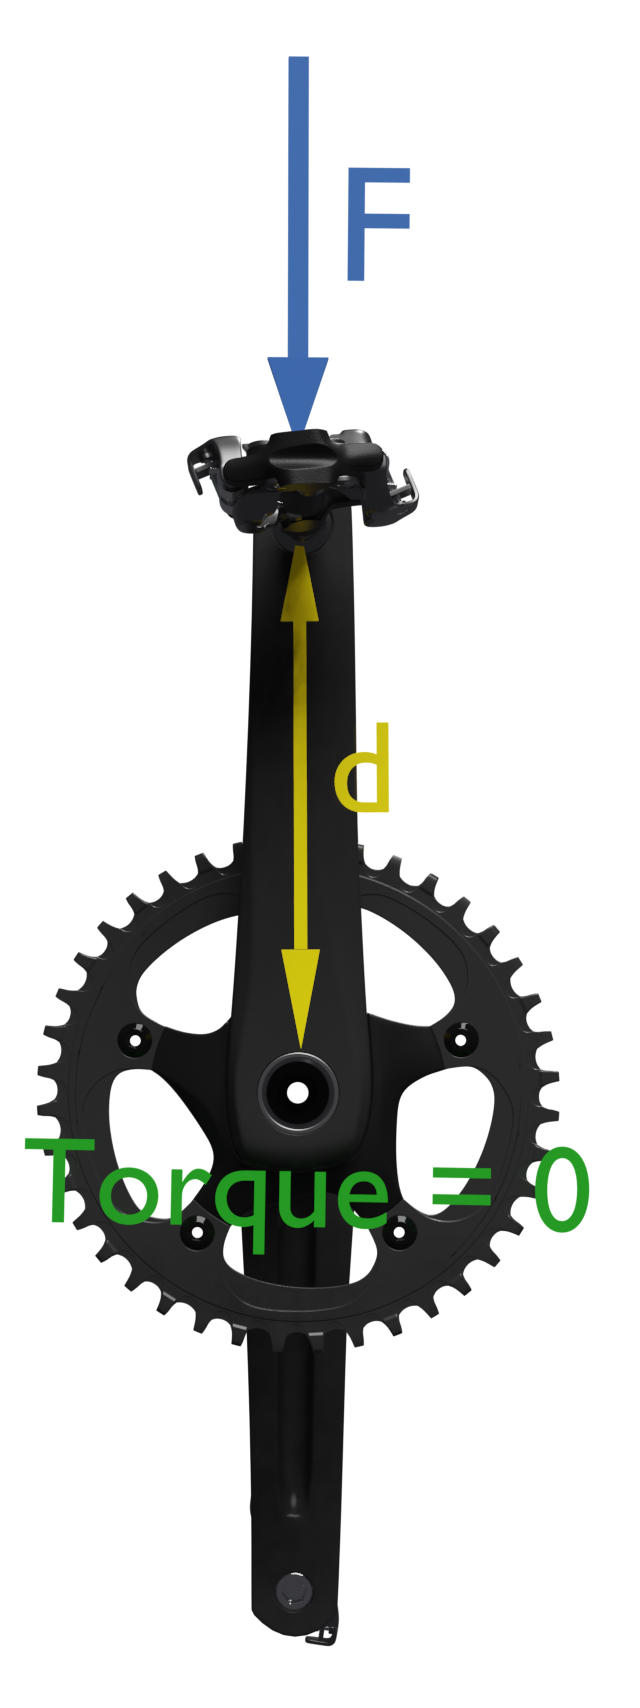
Mathematically: T = F · sin (0) = F · 0 = 0
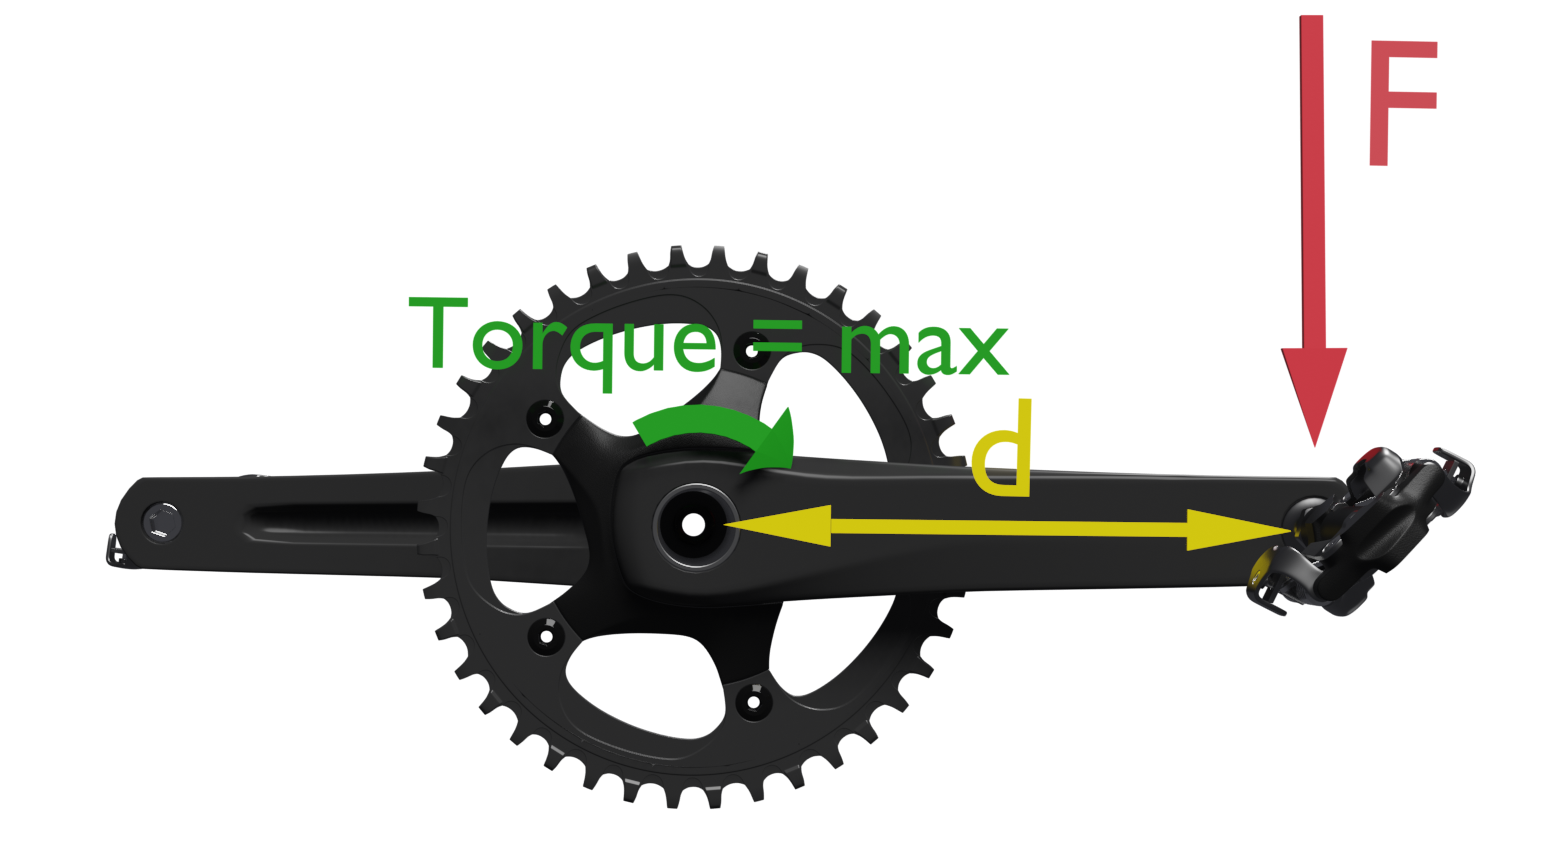
Mathematically: T = F · sen (90) = F · 1 = F
From all of the above we can conclude that the greatest efficiency in pedaling would be obtained by applying the force on our pedals always describing the tangential direction (perpendicular to the crank) which would generate 100% efficient torque, although this seems physiologically complex and would require control of the motricity of both legs beyond the reach of a standard human being.
Navigation concepts. Course and heading
In this article we discuss navigation concepts and look at the differences between course and heading.
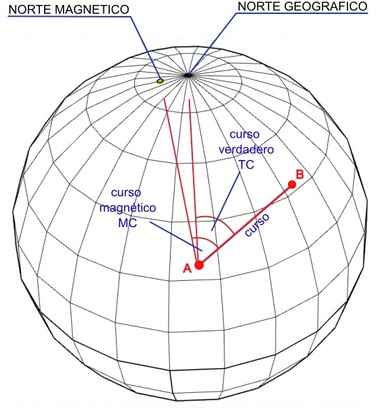
Course, true course, magnetic course y desired track
We will call course the trajectory to follow, it is the planned or desired route between two points A and B. It could be identified as the straight line that joins both points.
The true course (TC: True Course) would be the angle in degrees between the true or geographic north and the course. It is measured from the geographic (or magnetic) north in a clockwise direction.
Since the meridians on a map all point to true north, they can be used as 0 degree references to measure angles to true north.
Since the geographic north and the magnetic north pole do not coincide (see the article "Magnetic declination" in the "Additional information, curiosities and glossary of terms" section of this site) we will also define the magnetic course (MC: magnetic course) as the angle in degrees between magnetic north and the course. It is measured from magnetic north and also clockwise.
In this case, the meridians cannot be used as references of 0 degrees, instead we will use the compass.
In some environments, the Desired Track (DTK) refers to the true course and the magnetic course interchangeably , depending on the north used as reference (geographic or magnetic).
Heading, true heading, magnetic heading, drift y drift correction angle
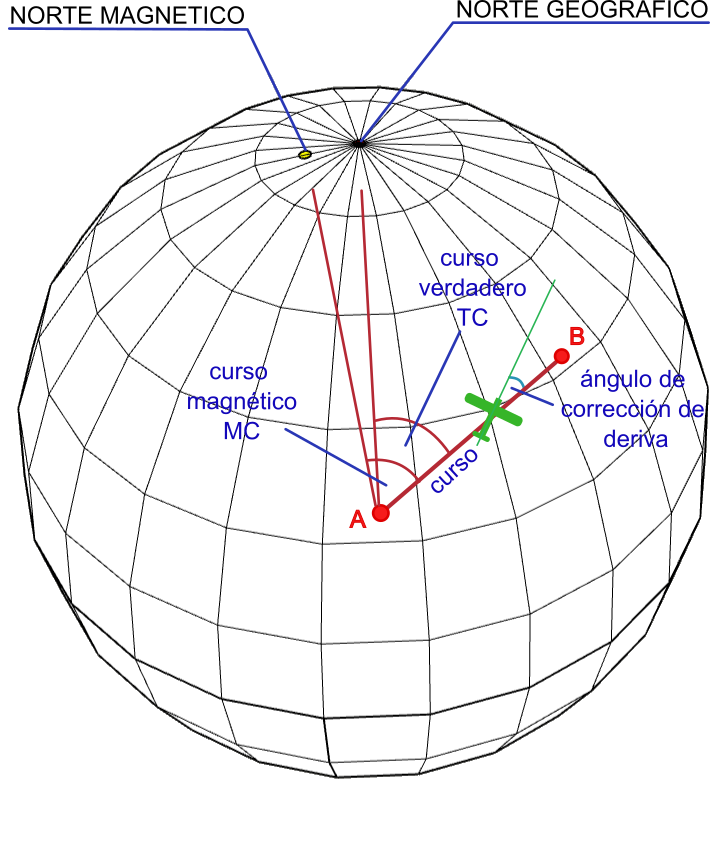
We will call heading (Heading) the angle formed by the north (geographic or magnetic) and the longitudinal axis of the aircraft (in the case of an airplane it would be where its nose points). It will be called true heading (TH: True Heading) if the angle is taken with respect to geographic north and magnetic heading (MH: Magnetic Heading) if it is taken with respect to magnetic north.
The heading does not necessarily coincide with the course since the aircraft or ship can change its orientation to counteract a crosswind or water currents. In the case of airplanes it is usual that, to maintain a constant course, the aircraft turns its nose slightly towards the wind.
##publi##
The angle formed between the desired course and the heading of the aircraft will be called the drift correction angle (WCA: Wind Correction Angle) since, by definition, drift is the deviation of a ship from the established heading, for effect of wind, sea or current.
It's basically the difference between where the ship is pointing and where it's actually moving. This angle is usually calculated by the flight computer. If the wind comes from the left, the correction angle will be negative. If it comes from the right it will be positive.
GRISC index explanation
In this article we will be adding information regarding our GRSIC route difficulty index.
Subjetivity of a route's difficulty.
The first thing is to indicate that the difficulty index is calculated for an average state of fitness, each person depending on their state of fitness can appreciate that for example a route is easier than indicated if their state of fitness is very good, or the opposite, a route that we classify as average, someone who has a low state of fitness may find it difficult.
Difficulty ratings will be calculated for only three types of routes as detailed below:
- Walking Routes
- Cycling Routes
- Running Routes
Activities or plans that do not belong to any of the above types shall not show a difficulty index.
Tpypes of routes according to its difficulty.
The rankings we offer are as follows:
| Very Easy | GRSIC less than 25 | |
| Easy | GRSIC between 25 and 50 | |
| Medium | GRSIC between 50 and 75 | |
| Hard | GRSIC between 75 and 125 | |
| Very Hard | GRSIC greater than 125 |
To calculate the GRSIC difficulty:
For the calculation of the difficulty index we take into account the following data:
- Distance covered on the route
- Elevation Gained
- Elevation Lost
- Altitude of the route
Share a route
Sharing activities
We know that sometimes you may like to share with others a route you have done, or a plan you are going to do in the future.
Here are some of the ways to do this.
Share a 3D route animation
In the following video, you will see the basic way to share a Sicami route. Please note that the privacy of the route must be set on Friends or Public for you to be able to share it.
First, let's see how to share a 3D animation.
How to share a view / 3D animation on Android
Share an activity or plan
Now we will see how to compare a route (Activity or Plan). As you will notice, the procedure is the same.
About types of activities
Types of activities
We will explain in this article how to change and predetermine the type of activity (cycling, hiking, walking, trekking, etc.) for our activities and plans in Sicami.
The type of activity will be useful to be able to carry out searches later, filtering by this data; and, for example, for power calculations, especially in cycling, since the values will change depending on whether it is a Mountain Bike or a Road Bike.
Activity type configuration
This video explains how to configure the type of activity for a specific activity or plan:
Modify activity type for a plan
Default activity type
This video explains how to configure the type of activity that will be assigned by default in new activities and plans:
How to modify default activity type for all activities or plans
Sync with Strava
Importation of activities from Strava
In this article, we will explain how to import into Sicami activities those you already have in Strava.
There are two ways to do it:
1. Manually: selecting the path we want to download.
2. Automatically: we configure so that Strava activities are automatically downloaded to your Sicami account.
In both cases it is necessary to previously have an account in Sicami, if you still do not have one, sign up at: Register.
It is also important to indicate that the privacy that you have specified in Strava is the one that will be used in Sicami. If an activity in Strava is public, in Sicami it will also be so.
Demonstration videos
1. Manually: selecting the path we want to download
The following video explains how to do it:
How to download activities from Strava manually
2. Automatically: we configure so that Strava activities are automatically downloaded to your Sicami account.
Sicami will check every 15 - 30 minutes approximately if you have new activities to download in your Sicami account.
The following video explains how to do it:
Spokes, hubs, rims, brakes and torques
Spokes on wheels with disc brakes and rim brakes
There is an immediate visual difference between road bike wheels that use disc brakes and those that use rim brakes and it is not only in the pads or the discs, would you know which of these pairs of wheels (same brand and model) ) corresponds to a disc brake and which one to a rim brake?
The difference is evident and it is in the distribution of the spokes of the front wheel.
Traditionally the spokes of the rear wheel have been placed with a different crossover than the front wheel. In many cases, the spokes of the front wheels had an exact “radial” layout, that is, they went from the center of the wheel (the hub) outwards and reached perpendicular to the rim.
Mechanical stresses on the wheels
The reason for this is that the mechanical stresses to which the front and rear wheels are subjected are different, especially the stresses on the transmission. Specifically, the rear wheel must transmit to the ground the torque (moment) of the force of the chain on the sprockets, which in turn is transmitted to the hub and from the hub to the rim and tire through the spokes. So the spokes are the “pillars” that transmit the spin from the axis of the wheel to the ground.
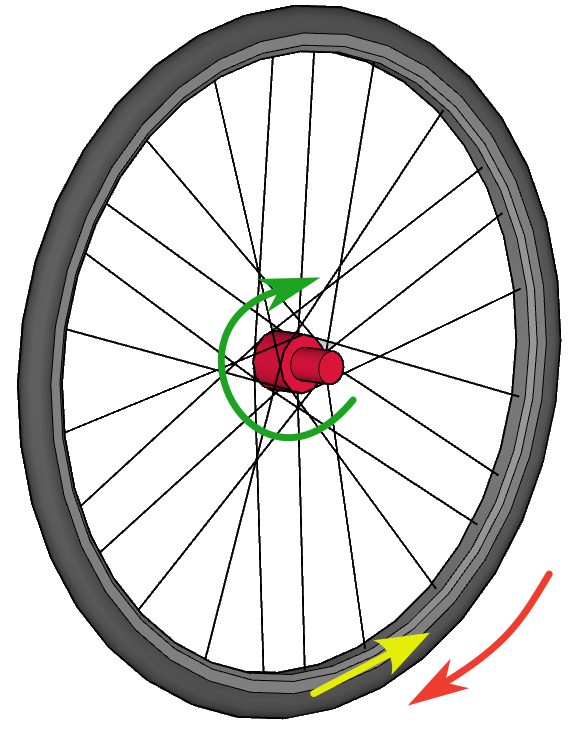
As the ground opposes resistance to the advance and rotation of the wheel, mechanical stress is generated on the spokes.
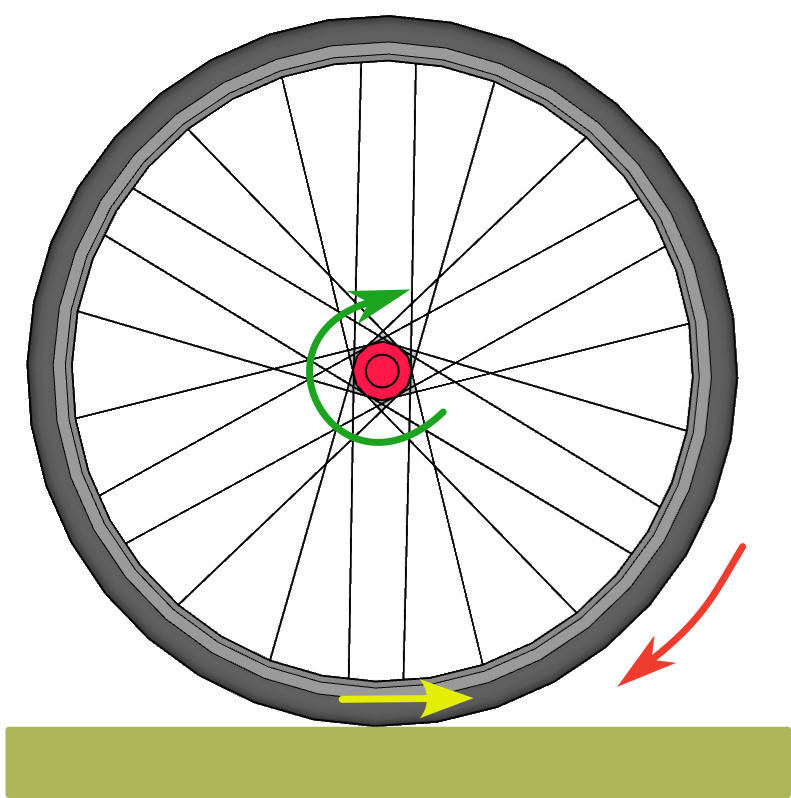
Mechanical stresses on wheel spokes
The main stresses to which a spoke is subjected will be compression-traction and bending, but how do these affect the mechanical behavior of the spokes? Compressive/tensile stresses act in the same direction as the major axis of the radius and will tend to shorten it (compression) or lengthen it (tensile). Bending stresses are the result of forces that act perpendicular to the main axis and will tend to bend it, so they are the ones that will have the greatest effect on the radius bending. We must consider that the ends are not free because in this case they will produce rotation and/or translation movements. We can imagine that the radius is "momentarily" fixed at the point of contact with the ground and imagine it as a rod fixed at that end. The axle-hub of the wheel is applying a force on that radius in the opposite direction.
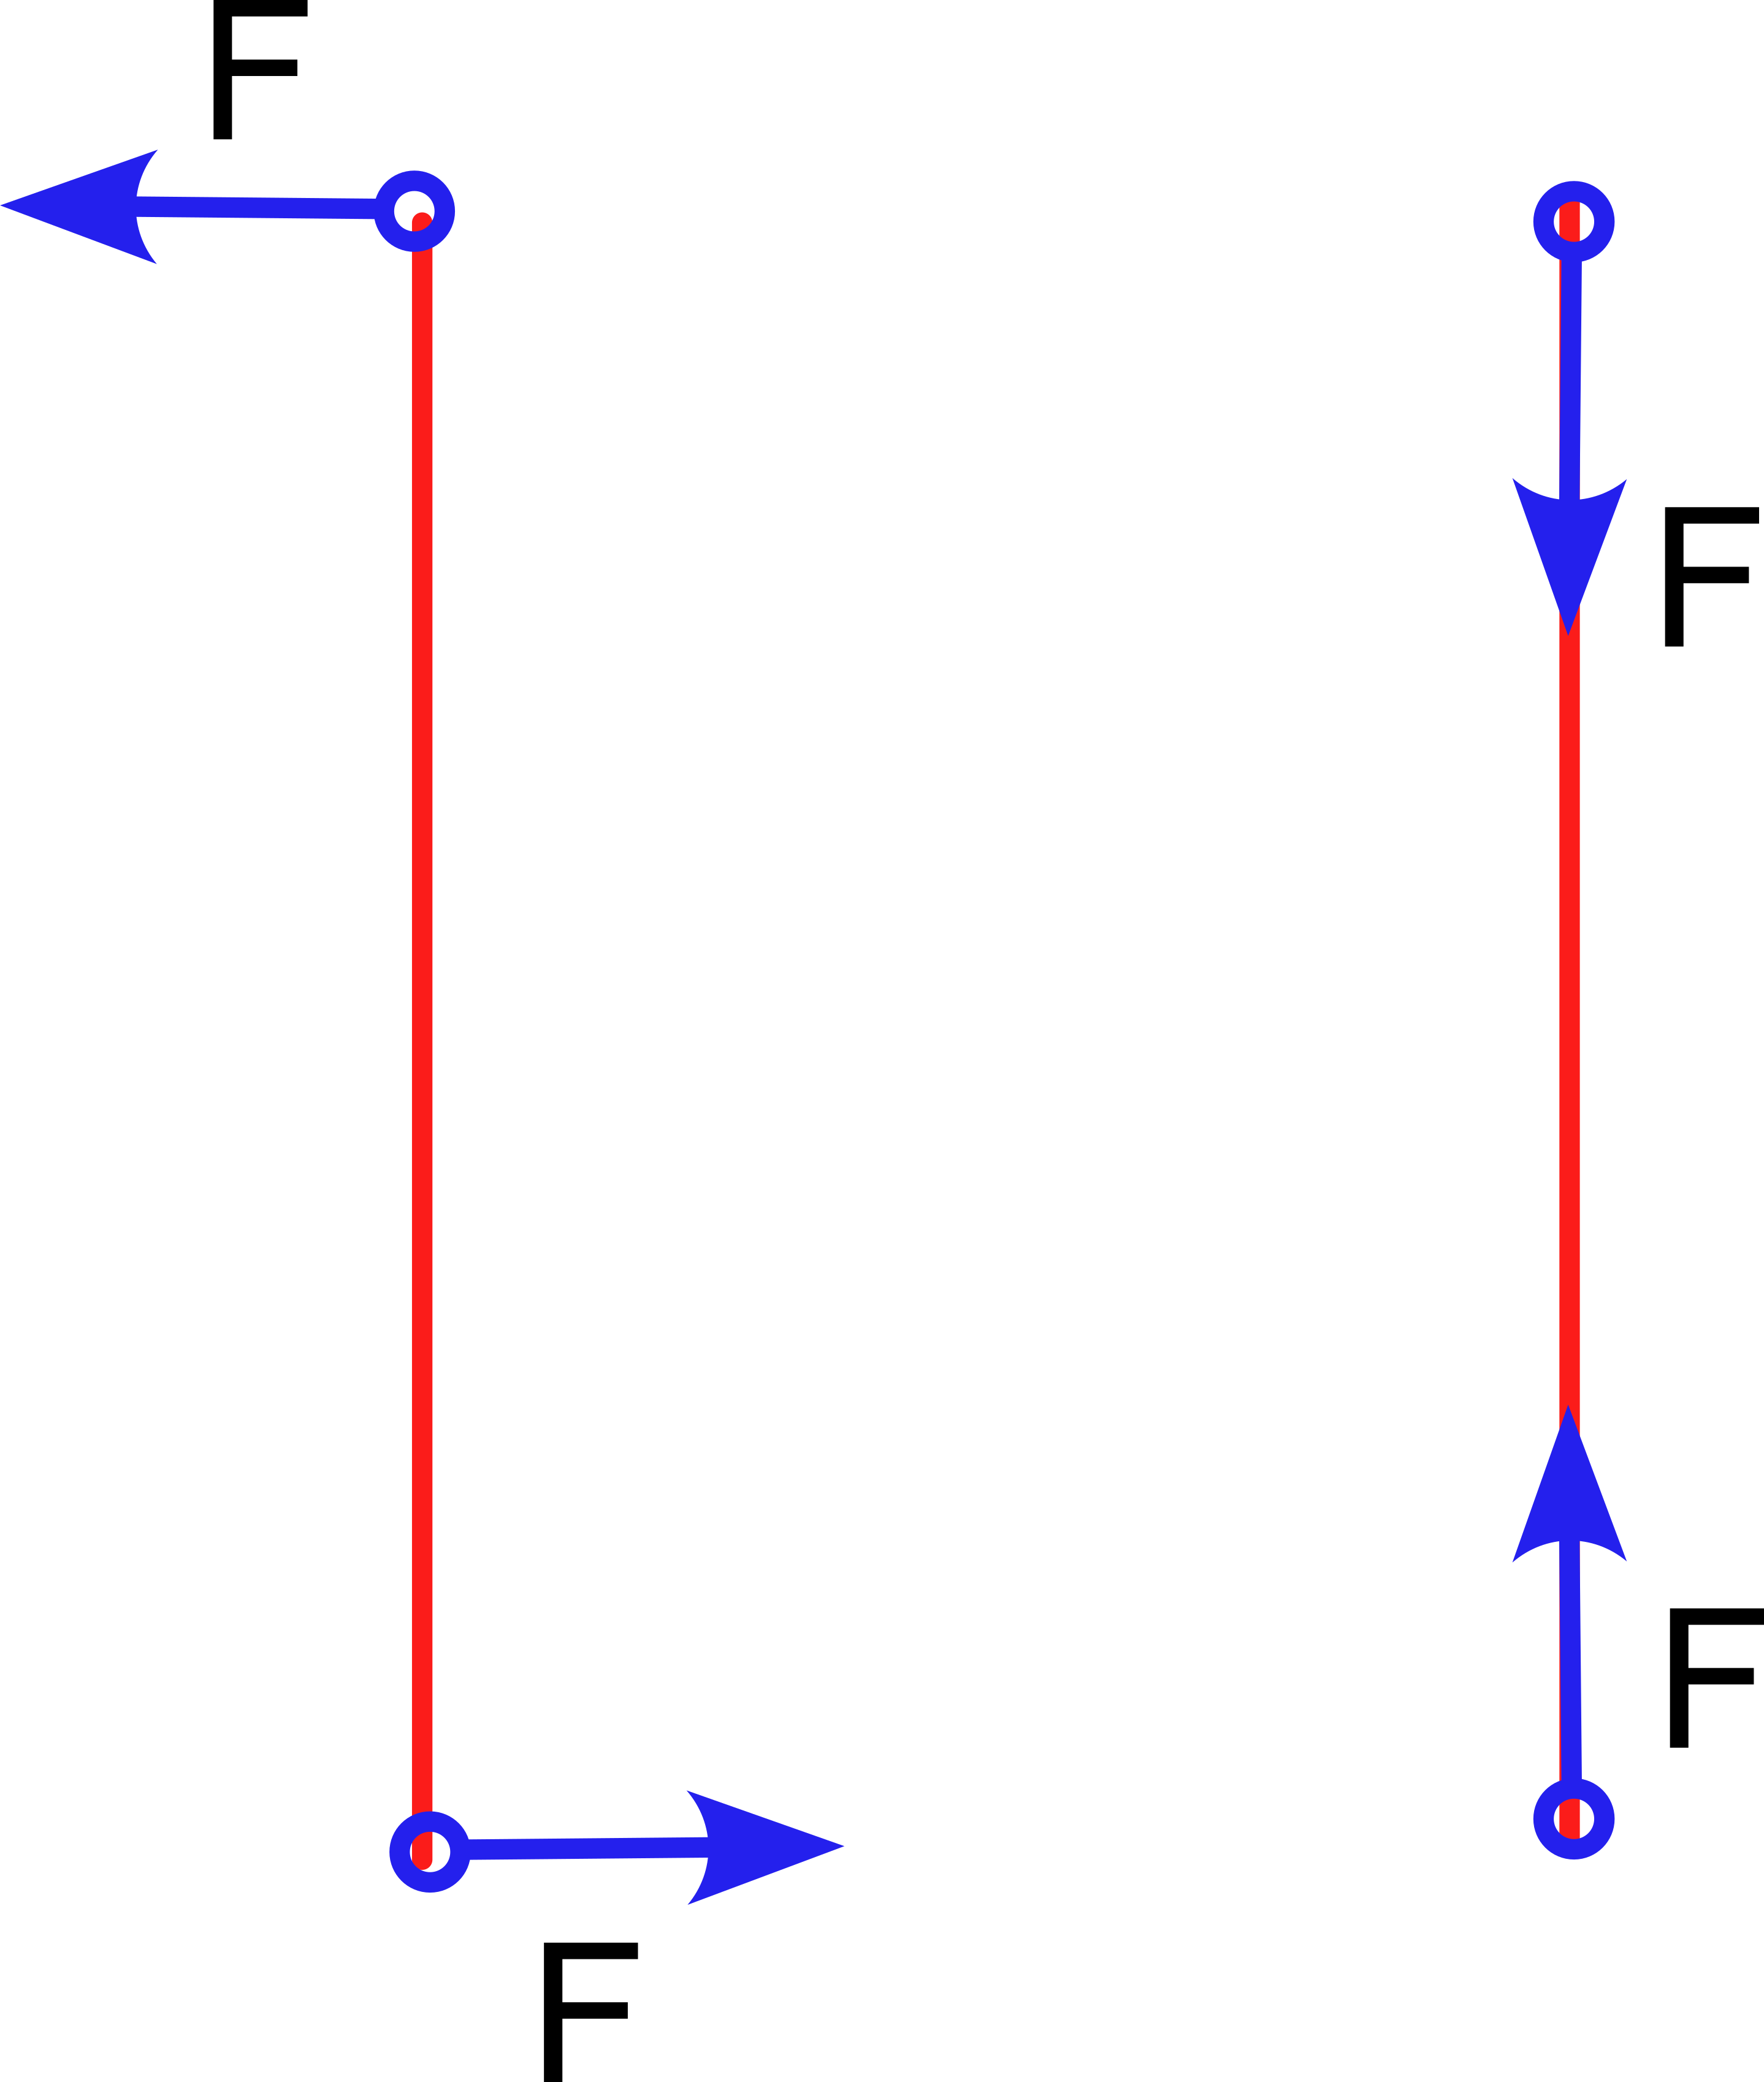
If we think about how much force is necessary to deform a rod of any metal, we surely conclude that it will almost always be easier to break a pencil by holding it by the ends and bending it than by resting it on the table and pressing on one of the ends.
Let's see how the radios are affected by these forces according to their disposition.
A spoke that is perpendicular to the ground at the point of contact will be subjected to forces in the opposite direction at each of its ends that will almost exclusively cause bending stresses, which are those that have the greatest effect on the spoke bending. In the case of a “crossed” radius, at the moment of contact with the ground, the force applied by the bushing has a bending component and an axial compression component, with which part of that total force will be absorbed by the material. Compressive forces have a much less significant bowing effect on a rod.
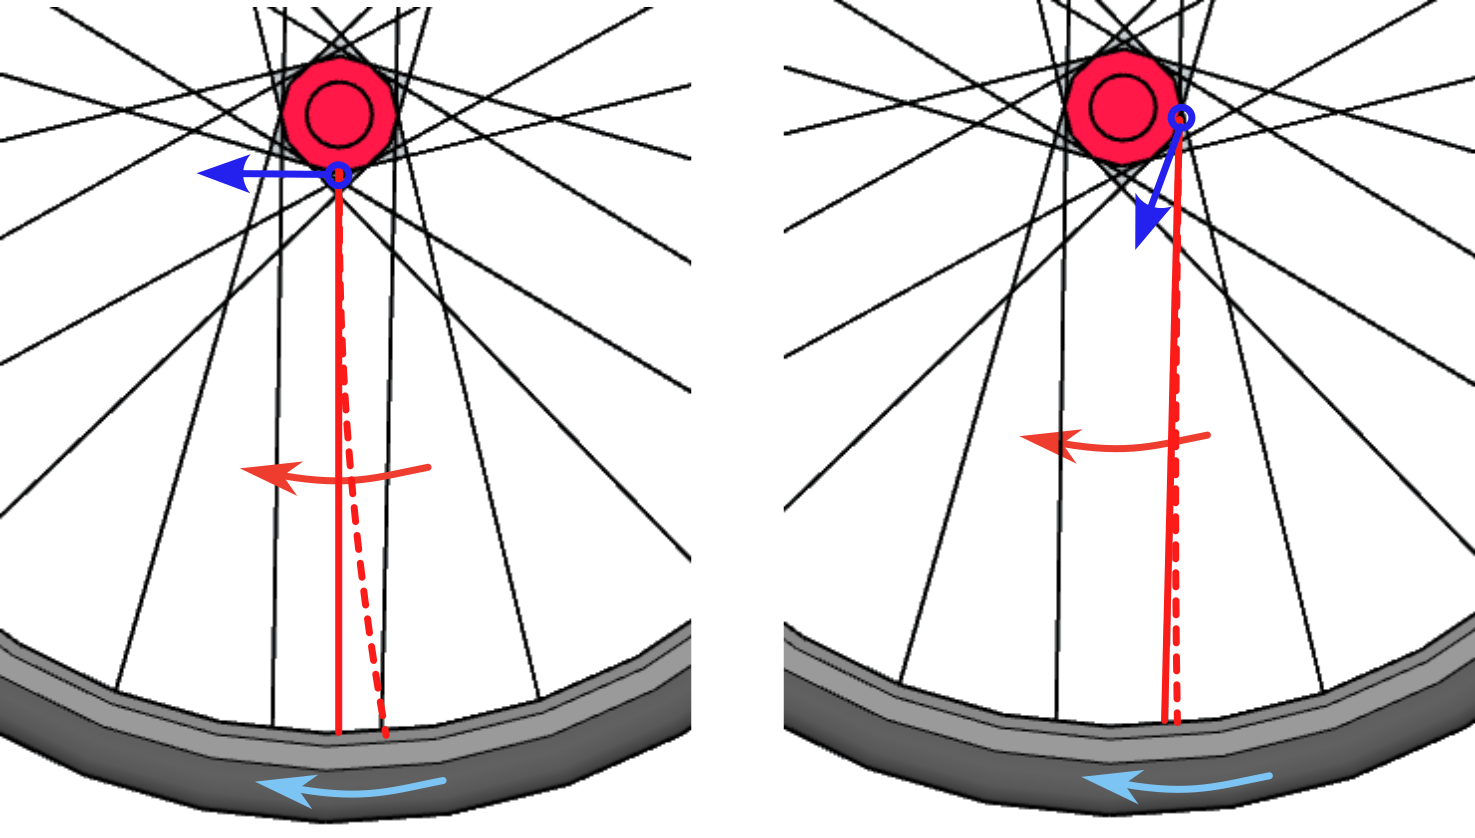
Another of the forces that act on these same planes of a wheel are the braking forces and let's not forget that effective braking occurs at the point of contact of the wheel tire with the ground. In the case of a rim brake, the force applied to stop the wheel is applied to the rim and this transmits it to the tire, located very close, so it is the rim that supports almost all the efforts with very little repercussion on the wheels. spokes. However, in the case of disc brakes, the braking force is applied to a disc attached to the hub, so this force must be transmitted to the rim and tire, the spokes being those force transmission elements. This is one of the reasons that today the front wheels of road bikes that mount disc brakes have abandoned the radial arrangement and adopted the traditional crossed spoke arrangement of the rear wheels as well.
Could this be the real reason for the broken spokes on Wilco Kelderman's disc brake wheel at the 2022 Giro d'Italia, when he lost almost 11 minutes on the descents? Some attributed it to the "heat" of the spokes due to the disc brake, although it seems difficult that so much heat could be transmitted from the disc to the spoke and that it would destroy it. Perhaps those spokes simply couldn't withstand the intense and repeated flexing stresses of hard, long downhill braking.
Bicycle geometry: Battle or wheelbase.
Wheelbase. Influence on the character and behaviour of the bicycle.
The distance that exists between the axes (hubs) of the wheels, measured from their center, is also called "battle", in English wheelbase and is a very determining element in the character of the bicycle. The shorter the wheelbase, the more reactive, mousetrap in curves and nervous the bike will be, also more rigid and therefore less comfortable, while longer wheelbases will make the bike more stable and comfortable, especially on straight terrain and at higher speeds. but also slower in their reactions. The wheelbase directly influences the maximum turning radius of the bicycle
The wheelbase obviously depends on the rest of the elements of the bicycle and its general geometry, although some of the most determining elements are the size, the angle of the steering and the advance of the fork or arrow. The following image shows how a offset fork (top image) will increase the wheelbase while a straight fork will decrease it.
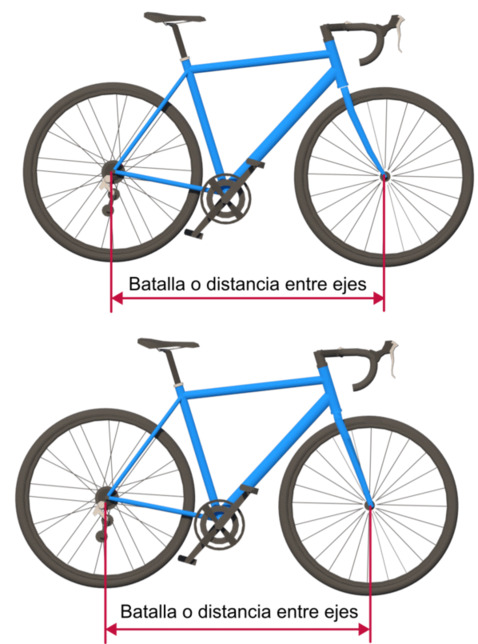
The wheelbase of road bikes is noticeably shorter than that of mountain bikes. In the latter, the battle is longer in order to be able to ride better on more demanding terrain. This difference in length can be 100 mm. or more.
##publi##
There are many more elements that determine the behavior of a bicycle and their influence is not individual, it already depends on the rest of the components, including the cyclist, and in any case, it would be the result of the combination, not necessarily the sum, of all of them. Let's take into account that the bicycle, unlike a car or motorcycle, has a much smaller total mass but, and this is very important, the distribution of these masses is very different. The element with the greatest mass in the bicycle-cyclist set is the latter which, together with its position, will cause the center of mass of the set to be at a higher relative height than in automobiles or motorcycles.
Let's not forget that the vertical distance from the vehicle's center of mass determines the moment of the forces exerted on the vehicle, including its "rolling moment". These moments are all the greater the greater the distance from the center of mass to the ground. This is one of the reasons why it is advisable to lower the position of the body when taking curves, because stability and security will be gained, being able to trace at a higher speed.
Regarding the geometry of the bicycle, the "bottom bracket offset", also known as "bottom bracket offset" is the one that determines the position of the center of gravity to a greater extent. This is the vertical distance between the horizontal of the bottom bracket and the horizontal of the hubs of the wheels. But we will talk about this parameter in another article.
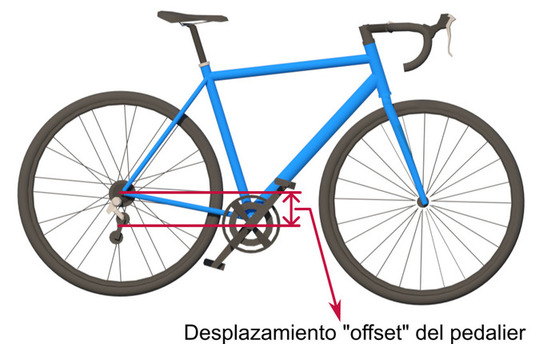
Self help for aging cyclists
¿Self-help? If you've gotten this far, you probably don't need it... I have already given more than 50 laps to the Sun 😎, although Strava does not have it registered. It is true that, in those days, Strava was not there, nor was it expected. My bones and my hair do keep a record of them, of these, I left many of them along the way and of those who continue with me, most have turned silver. My bones also remind me every morning that they are starting to lack some lube. I never knew which one they brought from the factory, whether it was wax, Teflon, graphene... well, surely not graphene, because in those days something like "graphene" would have sounded more like a lost planet from StarTrek 🖖 than a material Revolutionary, although it seems that, it was so everyday, that we used it every day at school for our homework.

Since we are talking about cosmic matters, according to the experts, in each lap I traveled 930 million kilometers and my average speed was, nothing more and nothing less!, than about 107,280 kilometers per hour 🤪. Well, multiply that by "50ysomething" and you will understand that there is no track that supports it...
In any case, bicycles did already exist, almost all of them with two wheels, their pedals, their handlebars... in essence they were like the current ones, although noticeably heavier. We had something in aluminum, but it was not within the reach of all pockets... although in reality it did not matter that much, if the motor was capable of moving them.
Well, it's eight in the morning on a blessed Saturday and here I am putting on my culottes once again while I drink a very hot coffee to wake up my mitochondria, which the other day I found out are in charge of most of the the energy supply of our cells, what things... by the way they look like this and they're spread out inside our cells.
Well, I'm going to take them out for a walk so they don't get stagnant... Ah! I almost forgot the "self-help" part 🥱... well... if you've already passed half a century... the most You probably won't need it... well, for now my recipe is for you to pedal for a while and enjoy this fantastic sport... I'm leaving now, I'll keep telling you when I come back...
Stories to not "lose the north"
Series of stories to "not lose the north": Greetings 👋 Probably because I am one of those cyclists that we now call "old school", or maybe times just change 🎵 The Times They Are A-Changing (Bob Dylan, 1963)🎵 and things stop being what they were (sometimes for the better). The fact is that there were certain unwritten customs or codes in amateur cycling that seem to have been lost in time "like tears in the rain" 🎬. I am referring today to the greeting between cyclists. As cyclists we are a vulnerable group and mechanics, almost always our ally, can sometimes play tricks on us. No one is exempt from suffering a mishap, a simple fall, a simple puncture...
Obviously, not saying hello does not imply that you are not willing to help if necessary, "facts are love, not good reasons"... but it does make recognition among us as colleagues and belonging to this group that in some way visible. I was always inclusive and supportive.
In short, and regardless of the environment in which we find ourselves, the greeting is still a sign of respect and consideration towards others, and sends the message that we have noticed their presence and that we recognize them as a person. It is also a sign of courtesy and good education. 👋
Series of stories to "not lose the north": Chupa ruedas If something seems to be clear to us, it is that the air does not belong to anyone and it is a good that we all share: animals, plants... although it is also true that humans we have a certain tendency to believe that we own everything under the sun. The air I leave behind when I ride a bike 🌬 doesn't belong to me, so I don't mind if another "cyclist" 🧟 follows me. Yes, I know that neither that vortex nor that turbulence 🌀they were there before I passed, but I don't know to what extent I can exercise any right over them. In any case, it is an energy that I left behind and that will be diluted in a short time, what difference does it make if someone uses it! Yes, you can go to my wheel, I have no problem, I just ask you not to sprint just before the end of the lane or just before the crest. Go ahead if you can, my legs hurt too... it will be more fun.....
Series of stories to "not lose the north": Numerology Well, I confess that my mountain bike is "a 26"... 👍 why don't I ride a "29"? Well, really, simply because when I bought it that was the standard for mountain bike wheels and so far, I haven't needed to replace it. I ride with colleagues on both 29-inch and 26-inch bikes and I really notice more differences from the skill and fitness of the rider 🚵 than from the diameter of the wheels on his frame. Go ahead, I am only an amateur, I do not compete, nor do I have the intention of doing so, since riding a bike is only my hobby. I understand that competition is another world, but it is neither mine nor that of most of the cyclists I know. Yes, among them, there are some owners of 26-inch " cucumbers" 🚀 who are beginning to look at their loyal mounts with hangman's eyes and I fear that they are going to recycle them without further consideration for the simple fact that they are beginning to be a minority and that seems to dishonor them.
Today I want to express my solidarity with those poor "scorned" who were once queens and are now victims of the hazards of the "market" 😢 .
They say that "29ers" have great advantages: their larger diameter makes them better absorb stones, potholes, roots and other obstacles in the terrain (because of their lower angle of attack), and also that they improve traction by having a larger contact surface ( more open arc of circumference) and, as they have a larger diameter, they also have a greater moment of inertia, making it easier to maintain speed once reached. On the other hand, they are slower when accelerating, more difficult to stop and less manageable, and that is why the length of the handlebars has increased accordingly. You know, big ship, big rudder. On the other hand, they have also increased their overall size and therefore their weight (with the same construction materials).
Just for information, a 29-inch wheel does not refer to the rim size that would actually be 622mm (24.5") but to the "theoretical" outer diameter of the tire. It matches the most common size for road bike tires 700c (622 mm). Regarding the theoretical circumference, for a 29x2.3-inch wheel it is about 2,326 millimeters while for a 26x2.35-inch wheel it is 2,083 millimeters, which means that in each turn a 29-inch wheel travels about 243 millimeters more.
In my case, all these advantages and disadvantages do not justify the cost of replacement. I practice both road and mountain biking, I enjoy both equally, I like the feeling of being light on the road 🪶, fast, notice how the force I exert on the pedals is transformed almost entirely into km/h 💪 , draw the curves almost without moving the handlebars... I prefer well-maintained asphalt and I don't like potholes, above all I want to go fast and score kilometres. When it comes to mountain biking, I like to feel that the impossible path does not exist, to feel the stones, the roots and the holes, to avoid them, to find the best route, to jump over them if I can. I really do not seek to be a bulldozer crossing the road mercilessly, I like to be respectful of the natural environment. And above all, I don't care so much about being fast as about going the route. I want to face the challenge, improve my technique, be more skilled.
Always from my humble point of view, I find that both the 26-inch and 29-inch wheels perfectly meet my needs as a hobbyist. If you have a bike with 26-inch wheels and it works properly, please don't feel obligated to replace it just because "29" is "mainstream", do it when you can or if your current bike is truly over its lifespan. .
As far as I'm concerned, my "donkey" 🐎I have ridden her for many years and she has always responded, and still does, with loyalty and obedience. She still maintains her original painting, although with some scars that her path left her, which, far from making her ugly, give her an imprint that beautifies her 😍. I hope that she will stay with me for many years and that we will cover many tracks together at 26-inch turns (2,083 mm per lap).
As a curiosity, the number 26 is the only natural number found between a perfect square: 25 = 5 x 5 and a perfect cube: 27 = 3 x 3 x 3. It is the atomic number of iron (Fe) and it is not a prime number (has more divisors besides unity and itself).
29 is a prime number (it is only divisible by one and itself). It can be obtained by adding 2, 3 and 4 squared 2^2+3^2+4^2 = 29. 29 is the atomic number of copper (Cu).
Geometry of the bicycle: Height and length of the frame. Stack and reach
Classical bicycle geometry
The shape of the bike has evolved remarkably over time. Although the most common geometry in recent decades has been formed by two adjacent triangles joined by the seat tube.
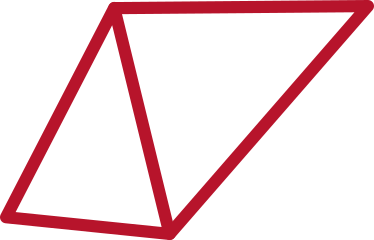
For many years a characteristic common to all the frames was the horizontality of the tube that joins the seat and the handlebars. The length of that tube largely determined the size of the bike.
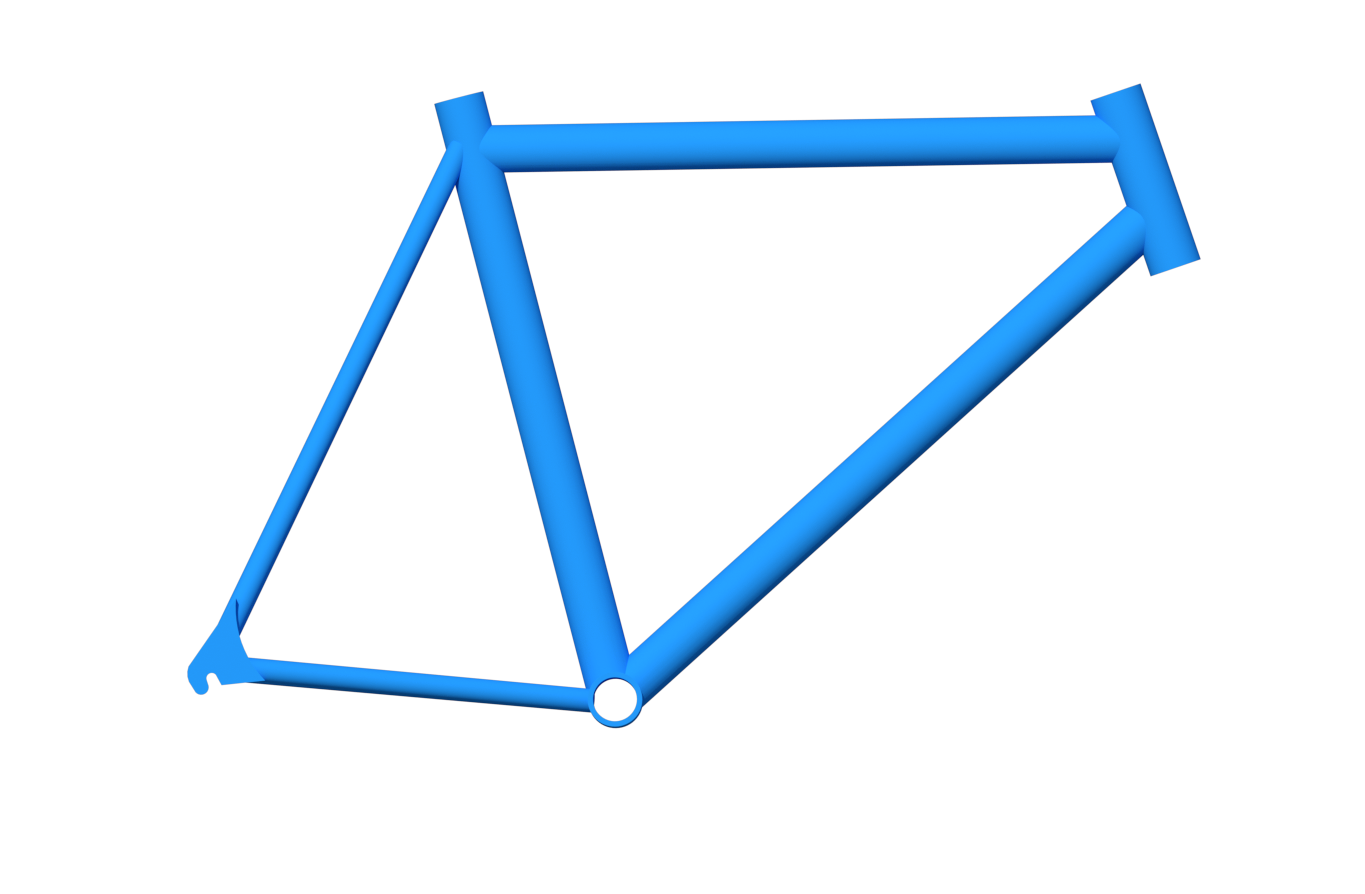
Sloping ‘horizontal’ tube. Sloping
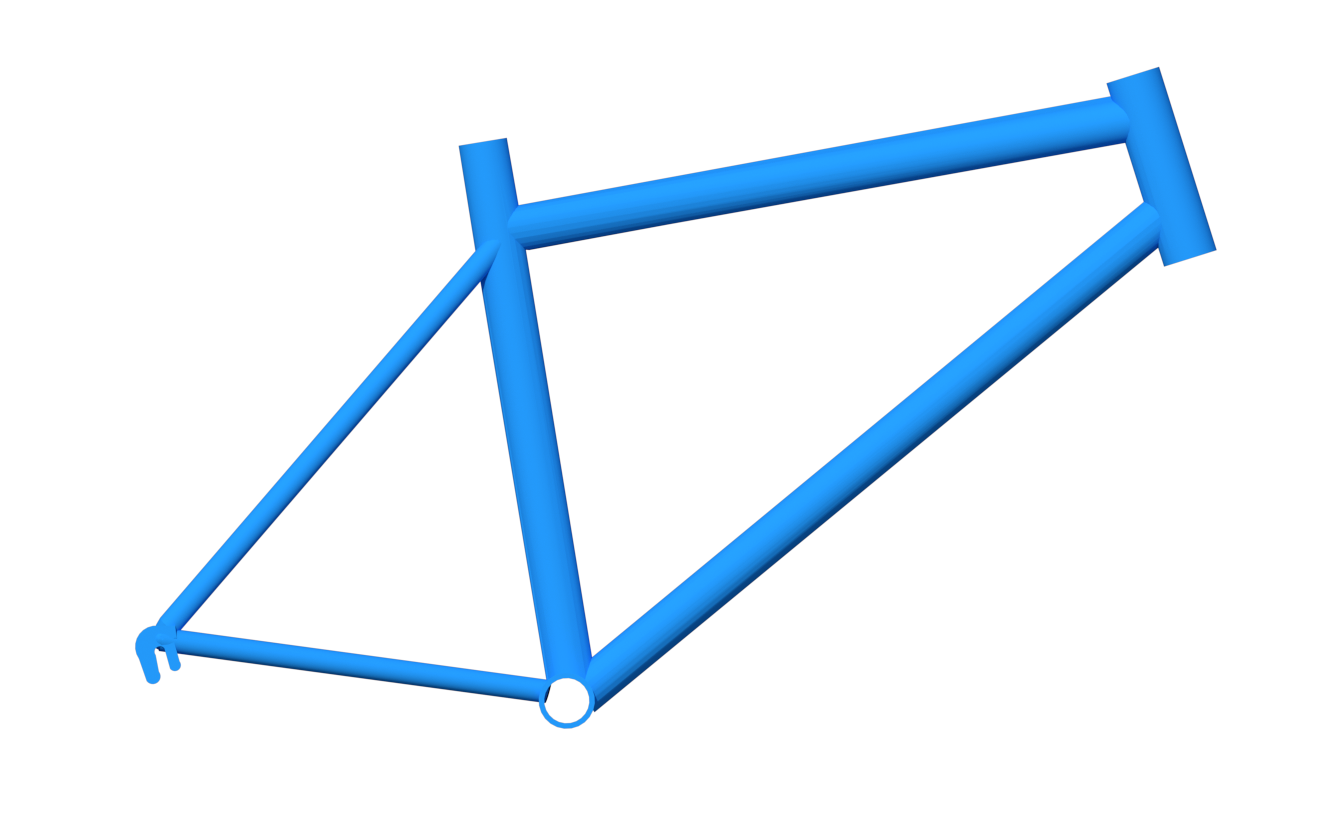
Stack y reach
To solve this problem, we can resort to two measurements that will perfectly define the geometry of a frame in terms of its size, these are the height ( stack ) and the length or reach ( reach ) and will have as a point of reference the bottom bracket axis and the top of the steerer tube (measured along its axis).The height or stack of a frame will be defined as the vertical distance between the bottom bracket axis and the top of the head tube.
The length, scope or reachwill be the horizontal distance between the bottom bracket axis and the top of the head tube.
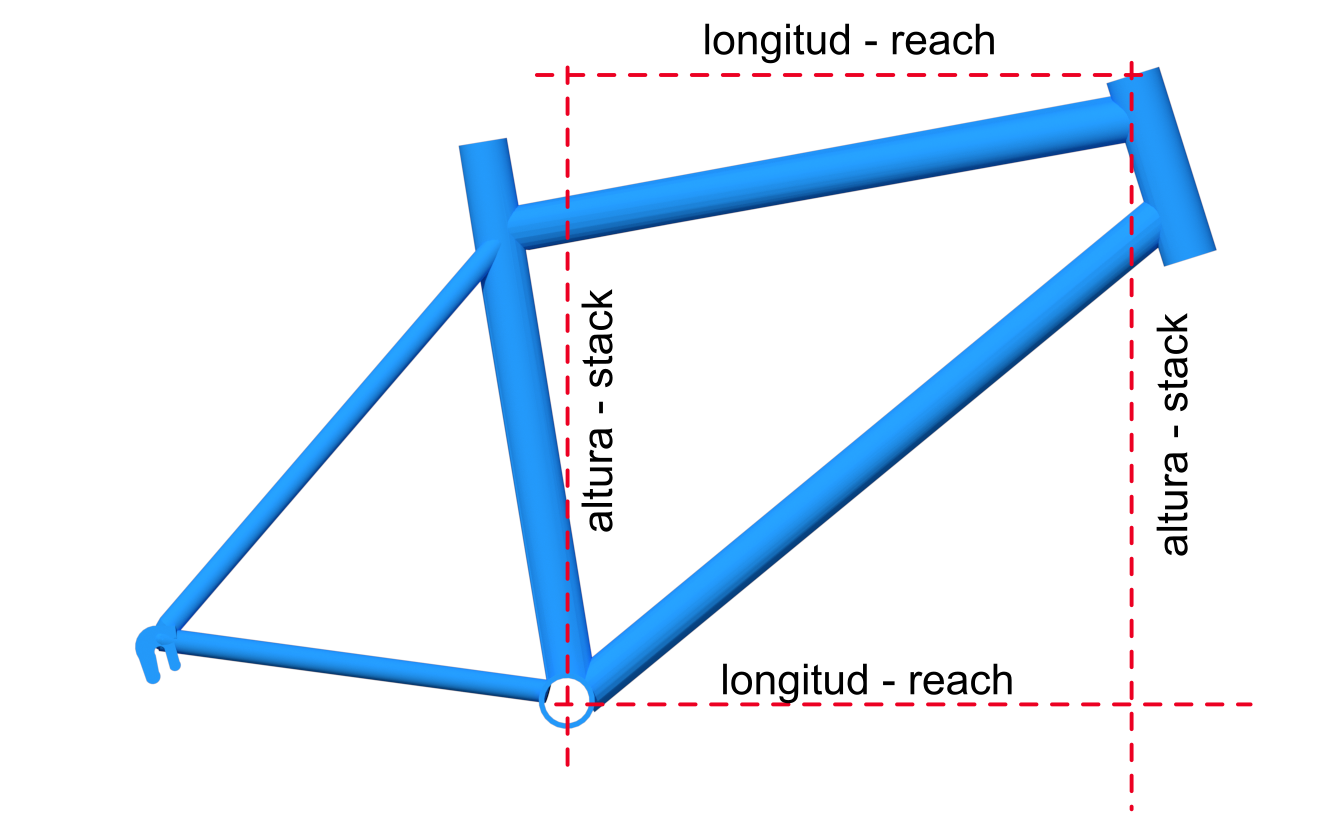
Since we are not going to find any exactly horizontal or vertical element in the box, both will be imaginary lines, so we will need to use a tool, such as a spirit level, to be able to determine them.
In future articles we will develop the subject of bicycle sizes and the importance of choosing them correctly.
Basic knots, useful and easy to make
The rope
Guide to useful knots If there is an element that can truly be useful when we move in natural environments, that element is, without a doubt, the rope. Throughout our extensive experience playing sports in natural environments, we have encountered circumstances on multiple occasions in which it was necessary to use ropes to solve any eventuality. Obviously when climbing or progressing via ferrata it is an essential element and its knowledge and management is a matter of maximum safety. But it has also proven useful in many other conditions, especially in emergency repairs or simply to secure items to prevent loss.
You can always find somewhere to go well equipped.
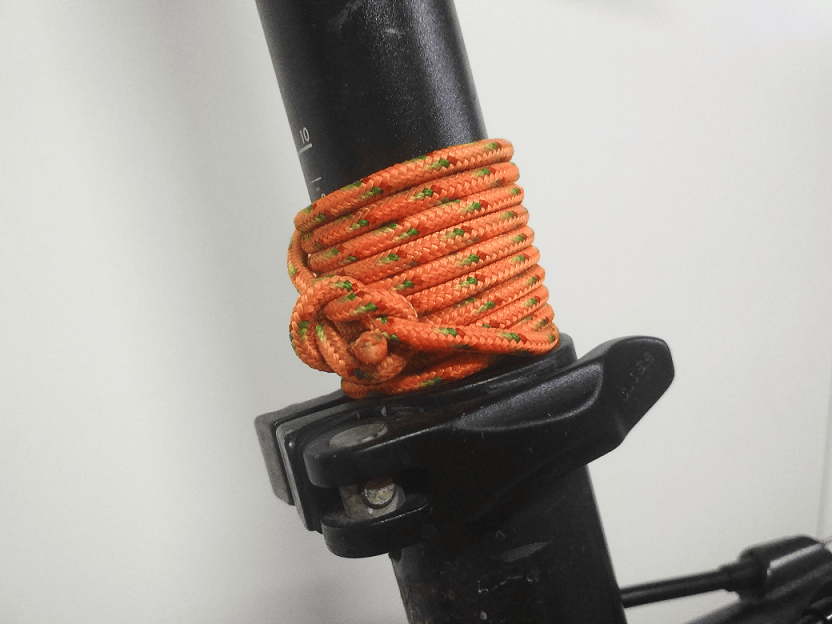
Warning! some sports activities require knowledge and mastery of the specific technique, please do not assume unnecessary risks and seek advice from an expert professional who knows the risks and techniques of the activity
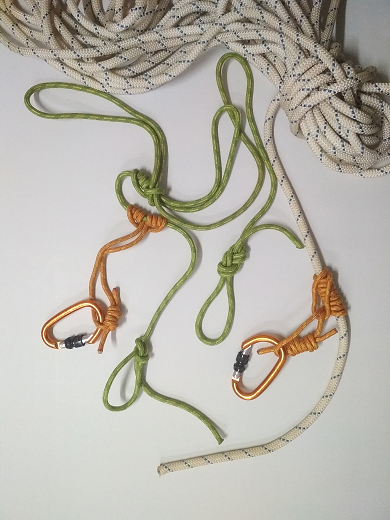
The knots
But for a rope to be really useful it is necessary to modify its shape properly, for this we will use knots . By definition, a knot (from the Latin nodus) is a loop that tightens and closes so that with difficulty it can be released on its own, and the more one pulls on either of the two ends, the more it tightens.
The main characteristics that a knot must meet are: that it be easy to make, that it be easy to undo after use with a load, that it be resistant and that it serves the purpose that we are going to give it.
Rope and knot parts
First, some definitions...
Cape: A cape is another name for a rope.
Chicote: it is the end of the rope, the tip.
Sign:is the rest of the rope with respect to one of its whips.
Sine: it is a loop, loop or fold of the rope. It also occurs when crossing the whip on the firm.
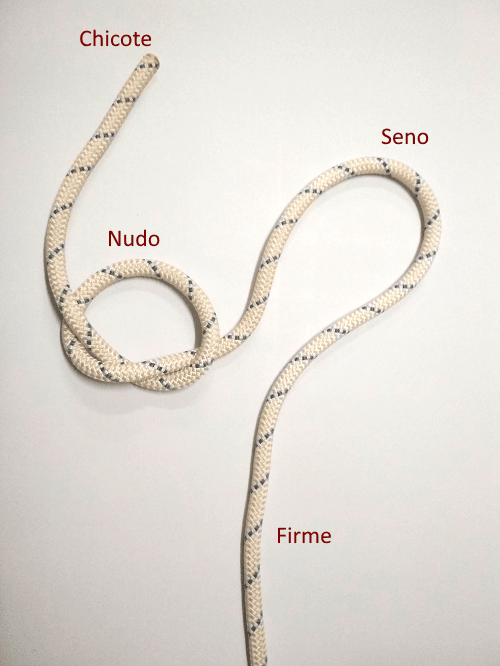
Cordino: We will call the strings of smaller gauge, 4-8 mm.
Some common knots
Eight knot
It is the most used knot in climbing to join the harness to the rope. It is a very safe and resistant knot, easy to execute and easy to untie when it has been under load. There are two ways to build it that will be used according to the case. The basic form is built as shown in the figure:
Knot of eight per sine
It can be used as long as the anchoring element allows its opening, as in the case of carabiners, maillons, etc. since we will start from a closed loop. To do it we will make a simple knot but giving an additional turn.
In the first step we will make a loop or trough that we will pass over and around the pavement, going around behind it, so that another loop will be created, in this case formed by a double rope. Subsequently we pass the end of the loop through the interior of the formed sinus. It only remains to tighten and "comb" so that it remains as shown in the last figure.
Knot of eight by whip
We will use this method when it is necessary to pass the whip through the anchoring element when it is closed, as in the case of the harness, rings, etc. For its construction, we start from the basic figure-of-eight knot and we will pass the whip through the ring, harness... Next, we will follow the route of the base knot in the opposite direction with the whip.
Bowline knot
Another of the most used knots in climbing and rescue, also for lifting loads. It is a knot that does not slip and is easy to make and undo. This knot should only be used under load as it stays open as soon as the tension is removed.
It begins by making a simple loop, in the lower figure we have passed the free end over the firm. Next, pass the whip through the loop from the bottom up and go around the firm from behind. Pass the whip through the loop again, but this time from top to bottom. Tense. To increase the security of the knot, preventing it from coming undone easily when it is without tension, it is advisable to finish off the excess end with an additional simple knot.
The usual thing is that the anchor point is closed, as in the case of a ring, or that the open part is inaccessible, as in a tree, a high pole, etc... so it is convenient to practice the execution by whip such as is shown in the following figures.
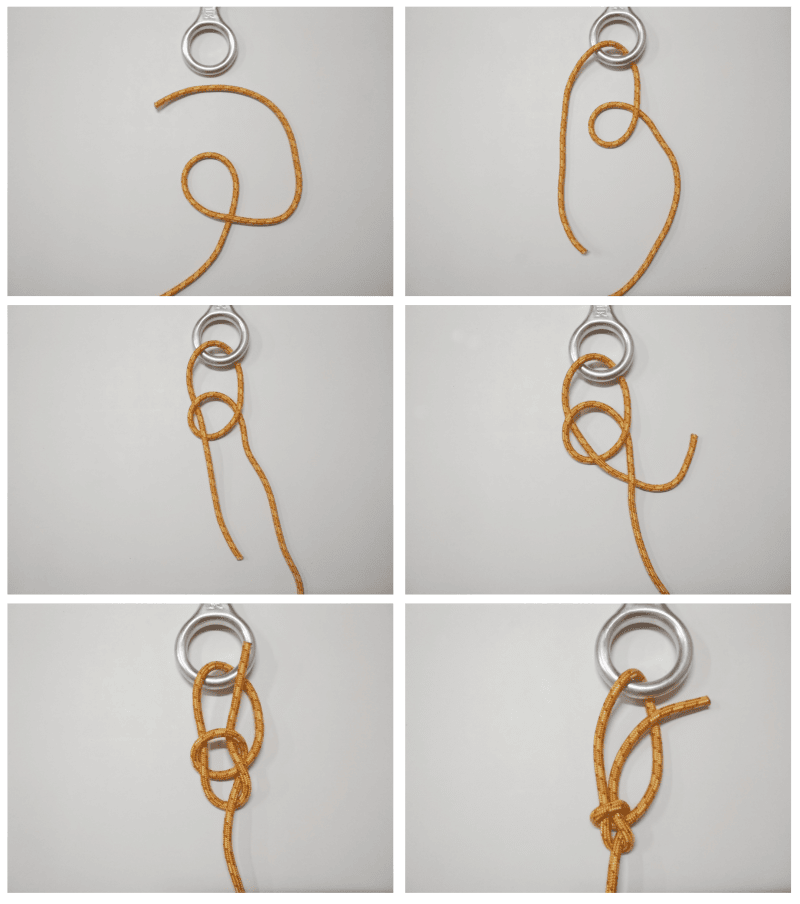
Clove hitch knot
It is usually used to secure the rope to a pole, bar or another rope, which is why it is widely used for tent supports. It is a knot that will tend to loosen if it is subjected to stresses from different directions.
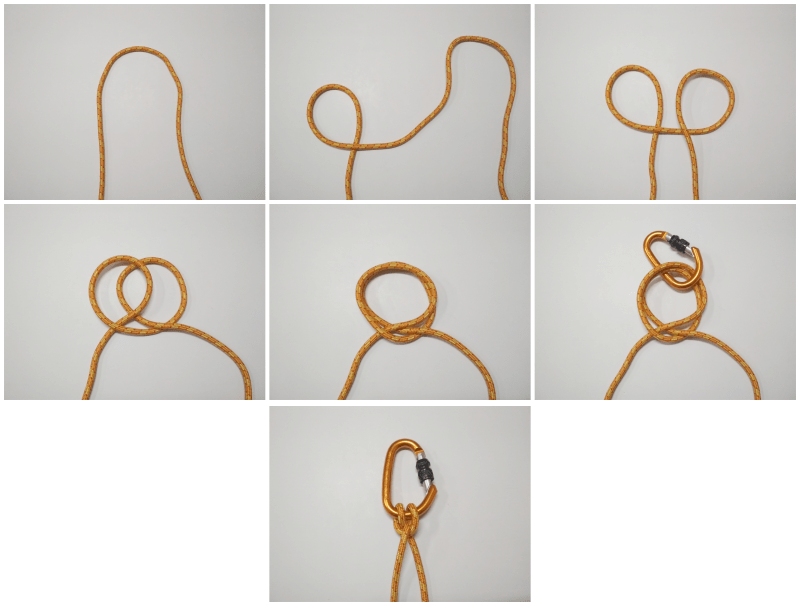
As in previous cases, if the anchor point is closed or the ends are not accessible, it will be necessary to apply the whip construction method.
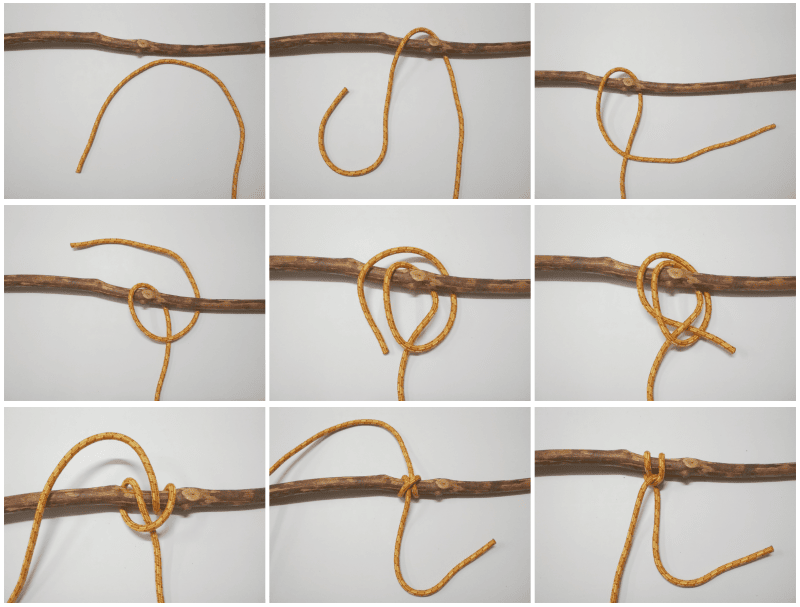
Double fisherman's knot
We will use it to join two ropes together or to close a rope or cord in the shape of a ring. The latter will be essential to be able to make some of the knots that we will mention later.
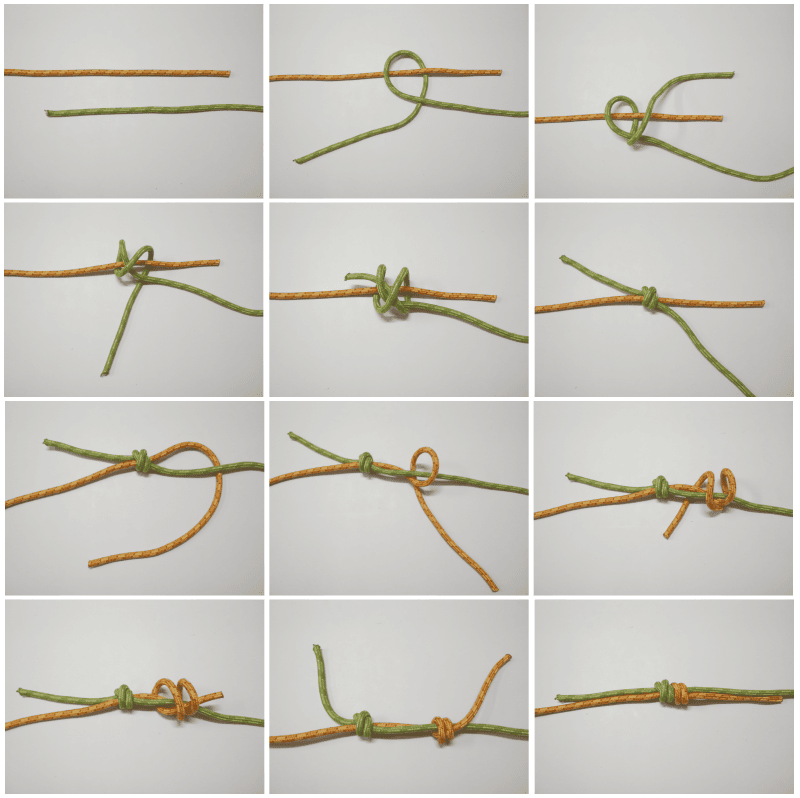
Skylark knot
Very simple knot for direct anchoring on rings or posts. It is usual to do it with a loop closed in a ring.
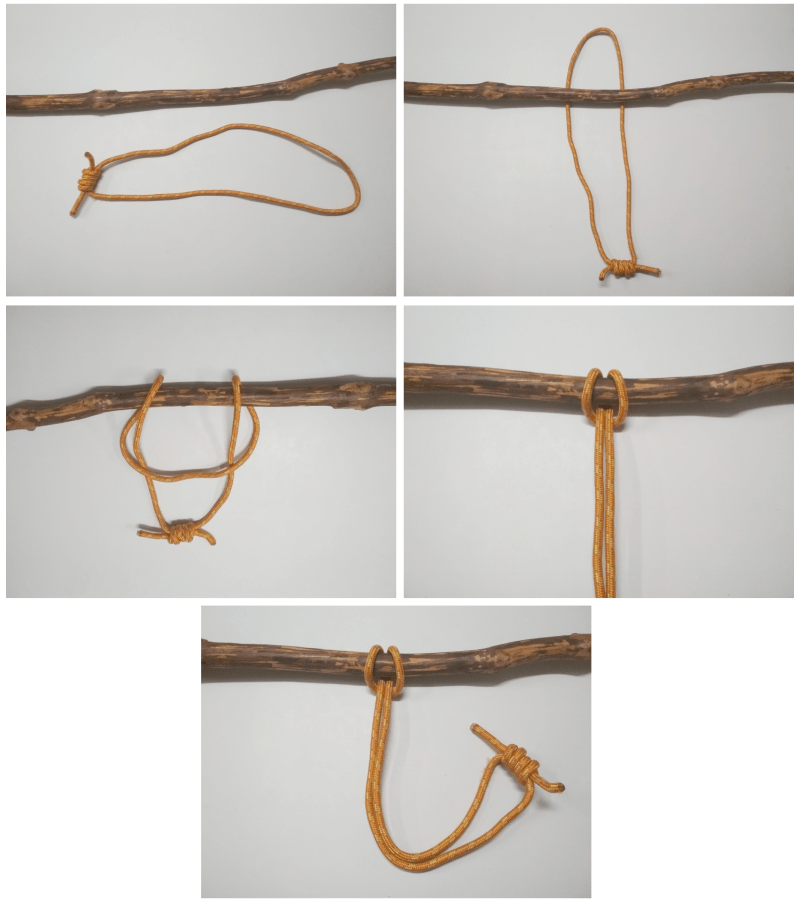
Although it is also possible to do it with an open end. It is advisable to secure in a knot by passing the excess short end inside.
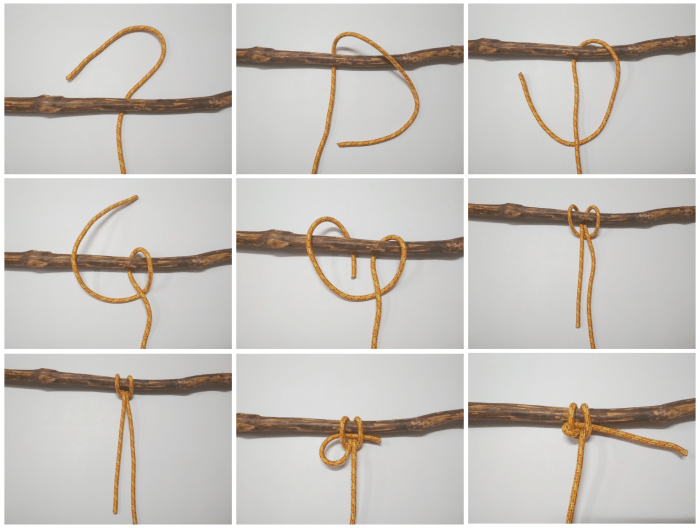
Roman knot
It is a knot in which the ropes will come out in opposite directions creating a directional loop aligned up or down with respect to the main rope line. It has application in hoisting, hoists, rope tensioning, stirrups, ….
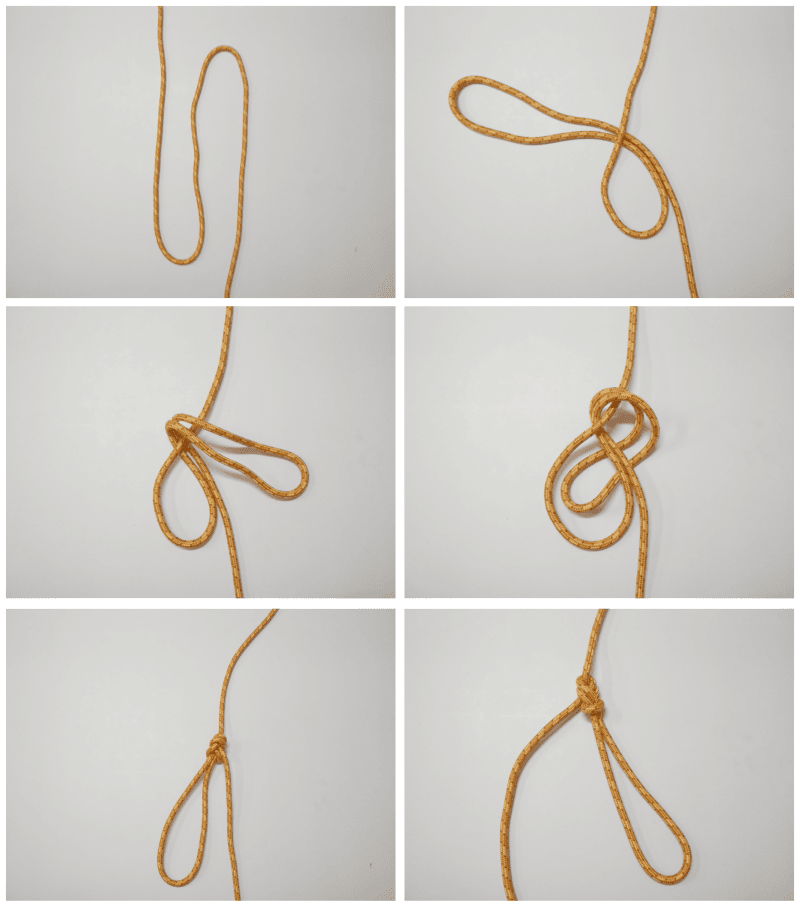
Figure-of-eight knot
Similar to the Roman knot, but in this case it is based on a figure-of-eight knot. The strings will also come out in opposite directions creating a directional loop aligned up or down from the main string line. The application will also be in hoisting, hoists, rope tensioning, stirrups, ….
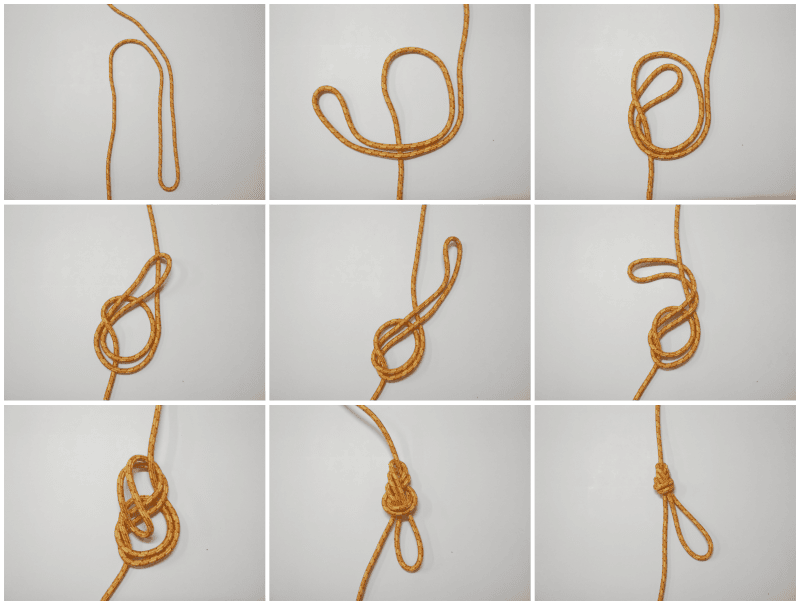
Prusik knot
It is a self-locking knot for which a cord is used in a closed ring loop. It is used on another main rope with a larger diameter. The knot slides easily when not under load, but locks as soon as it is under tension as it pinches the main rope. It is used as a method of self-belaying in rappelling, to go up on a rope, descend equipment... It is built by surrounding the rope as shown in the figures, successively passing one of the ends under the main loop. It is very important to fit the knot on the rope well before using it. Being a symmetrical knot it acts in both directions.
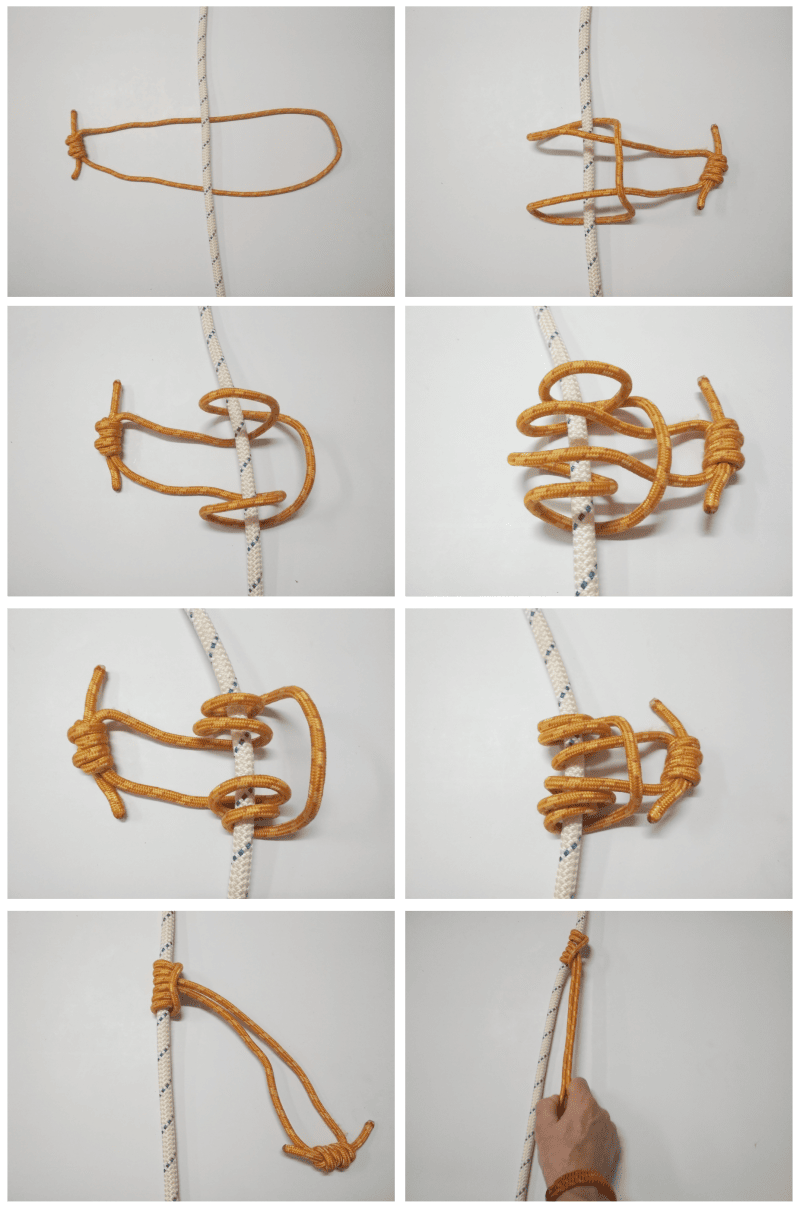
Machard's knot
It is another self-locking knot for which a cord will also be used in a closed ring loop. It is used on another main rope with a larger diameter. The knot slips easily when not under load, but locks as soon as it is put under tension by pinching the main rope. It is used as a method of self-belaying in rappelling, to go up on a rope, descend equipment... It is built by surrounding the main rope as shown in the figures to finish passing the lower end through the upper loop. It is very important to fit the knot on the rope well before using it. This knot, unlike the Prusik, only acts in one direction.
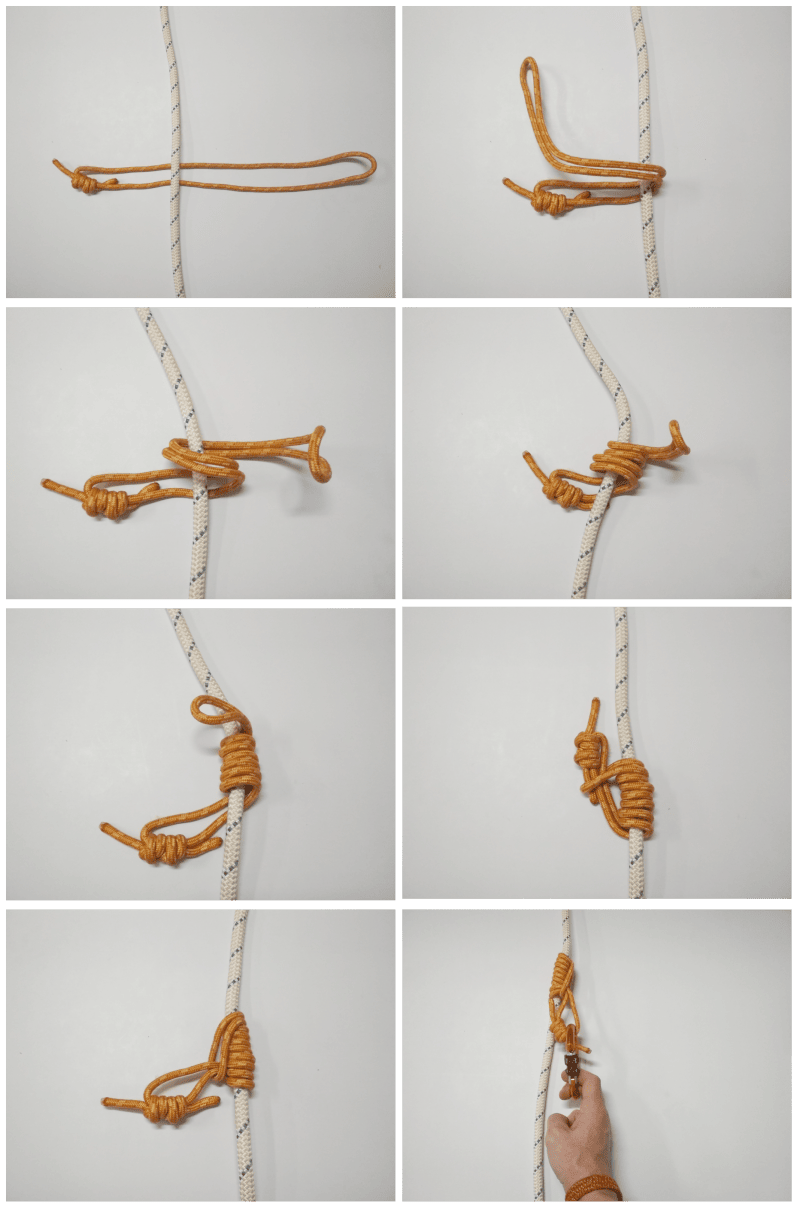
The diversity of existing knots is immense and would give rise to a specific treatise that is not the objective of this site, we invite you to delve into this exciting subject.
Biodiversity Iberian Peninsula
One of the main incentives for hiking, running, cycling or climbing is contact with nature. Probably all the practitioners of these sports have something in common their love of the natural environment. Here we want to provide information about the trees, plants and animals that we will usually find on our routes so that we know how to identify them and find out some curiosities and interesting facts. Publish and share your photos and help the community learn more about the biodiversity of your environment
Cork Oak (Quercus Suber):It is a regular on the Iberian Peninsula and the Mediterranean environment. The trunk is covered with a very thick cork bark (up to 15 cm), light and with deep longitudinal tears. It is usually exploited by removing the cork in the lower area, then showing a smooth orange rind. Its cork bark is the best identifier to distinguish it from its closest relatives, the gall oak (Quercus Faginea) and the holm oak (Quercus Ilex).
Common oiler (Berberomeloe majalis) Also known as carraleja, curita, curilla, puffin, curica... it is a beetle (commonly beetles). Its abdomen is very elongated and segmented, with orange or red transverse bands. Be careful not to touch it as it secretes a very toxic substance (cantharidin) that causes irritation and rashes on contact with the skin and if ingested it will cause vomiting, diarrhea and urinary problems. Cantharidin was used as an aphrodisiac in ancient times.
Remember that we must take care of the rural environment, more information in Responsible access to the rural and natural environment by cyclists and hikers
Your Stats
Data analysis
In this section, you can see the evolution of data that will help you understand the progress of your performance.
Information is displayed based on the time period you select. The graphs will help you quickly check your evolution.
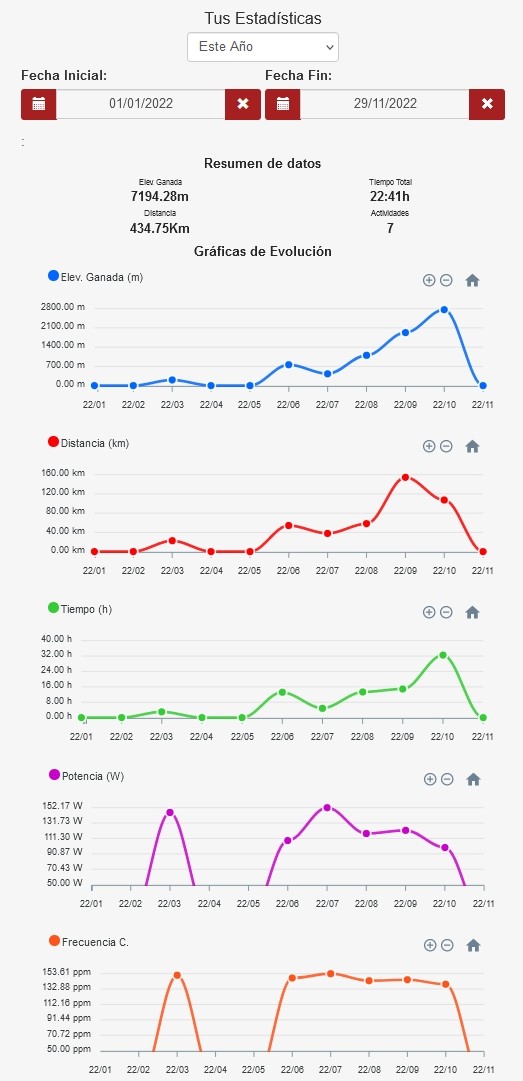
In addition to selecting a period, you can also choose a start and end date to view the period of time you want to examine.
If you are one of those people who seek to improve every day, the statistics section will be very useful, since you will be able to see the evolution of your parameters, what type of training is working for you and what is not. You will be able to make decisions with valuable information so as not to make mistakes.
You can choose to view statistics for the following time periods:
- This Year , which will show you the data for the current year.
- Today , you will see the data of the current day.
- This week , you will see the data.
- Last week , you will see the data.
- This Month , you will see the data of the current month.
- Last month, you will see the data of the past month.
- Last three months , you will see the data of the last three months.
- Last six months , you will see the data of the last six months.
- Last Year , you will see the data of the past year.
- Last two years , you will see the data of the last two years.
- Last three years , you will see the data of the last three years.
You can also manually select a start date and an end date to choose the period for which you are interested in checking your activity.
Suggestions
Is there any interesting information for you that we are not offering you? Contact us to assess the possibility of adding it.
Click on the following link and start enjoying your statistics now.
Additional information, curiosities and glossary of terms

GPS (Global Positioning System) and others global positioning systems
Global positioning systems are systems that allow locating an object on Earth with high precision.
More information in this link Global positioning systems
Geographical coordinates
Spherical angular coordinate reference system to represent locations on earth. At least three values will be needed to represent a location: one for the horizontal position, one for the vertical position, and a third indicating the distance to ground level, which is identified as sea level. The values of horizontal and vertical position are usually given in sexagesimal degrees, since these are angles whose center is the Earth.
More information in this link Geographical coordinates
Waypoint (point of reference)
It is a specific position of a point on Earth defined by geographical coordinates. It is identified by a name and usually includes an icon or graphic symbol and other additional information such as a comment, date, altitude.
Notation systems: sexagesimal degrees and decimal degrees
The sexagesimal system is used to express measurements of time and angles using three groups of values: degrees, minutes, and seconds. It is based on the number 60 and is the system traditionally used in paper maps.
Time: 1 h 60 min 60s
Angle: 1º 60’ 60”
In the case of geographical coordinates, for latitude the hemisphere to which they belong is usually indicated, north (N) or south (S), and for longitude, whether they are east (E) or west (W).
Example: 39°49'51.8"N 3°46'49.2"W
North hemisphere: Latitude between 0° and 90 °
South hemisphere: Latitude between 0° and -90°
To east of Greenwich meridian: Longitude between 0° y 180°
To west of Greenwich meridian: Longitude between 0° y -180°
In computer applications, the decimal system is usually used, in which minutes and seconds are transformed into a decimal number.
39°49'51.8"N 3°46'49.2"W = 39.831045, -3.780322
For the manual conversion of sexagesimal degrees to decimal degrees, the sum of:
Degrees + minutes divided by 60 + seconds divided by 3600:
Example:
39°49'51.8"N = 39 + (49/60) + (51.8/3600) = 39.8310
3°46'49.2"W = 3 + (46/60) + (49.2/3600) = 3.7803
To carry out the conversion there are multiple applications and calculators on the internet.
Unevenness and slopes
The unevenness, by definition, is the difference in height between two or more points. The zero level point will be the point where we start the route, regardless of the height of that point at sea level.
More information in this link Unevenness and slopes
Altitude, Height and Elevation
It is common to use the terms altitude and height interchangeably to refer to a location. Next we will recall the definition of these terms.
More information in this link Altitude, Height and Elevation
Basic notions on map interpretation
Isolines are used to represent the distribution of a variable (temperature, atmospheric pressure...) on a surface. The isolines are lines that join points with the same value on the surface, the value can be the one that is chosen, temperature (isotherms), pressure (isobars), precipitation (isohyets).
More information in this link Basic notions on map interpretation
Magnetic declination
The magnetic field generated by the Earth is not immutable, on the contrary, it constantly varies both in its position and in its intensity and also periodically (in cycles of thousands of years) it is reversed. Currently, he travels about 100 meters a day. Since a compass will always indicate the magnetic north pole, it is convenient to know the relationship or difference between the north indicated by the compass and the true or geographic north. This concept is magnetic declination. Magnetic declination (“variation” in aeronautical navigation) is the angle between true (geographic) north and magnetic north, that is, it is the difference angle between geographic north and the north that a compass will mark.
More information in this link Magnetic declination
Navigation concepts. course and heading
We will call course the trajectory to follow, it is the planned or desired route between two points A and B. It could be identified as the straight line that joins both points.
More information in this link Navigation concepts. course and heading
Types of maps
Maps can be classified according to different criteria, in our case we will classify them according to the content and mode of representation.
More information in this link Types of maps
Cartographic projections
A map is a two-dimensional representation of the earth, which has three dimensions, the transition from a three-dimensional representation to two dimensions is known as a projection.
More information in this link Proyecciones cartográficas
Clouds
Clouds can give us valuable information, we are going to review the different types of clouds that we can find on our outings.
More information in this link Cloud types
Oruxmaps and Sicami collaboration
Oruxmaps
We collaborate closely with OruxMaps, which is possibly the most complete Android application for managing online and offline maps, ideal for hikers, cyclists and sporty navigators.
Still don't know OruxMaps?
Some of the features of the integration with OruxMaps
- Sicami is compatible with the following versions of OruxMaps GP v10.0.0
- OruxMaps GP v10.0.0 and higher
- OruxMaps 9.7.0 Beta 18 and higher
- Routes made from OruxMaps can be automatically exported to Sicami.
- Routes that are in Sicami can be loaded in OruxMaps.
- From OruxMaps you can search for Sicami routes.
- The routes that exist in Sicami can be loaded in OruxMaps to follow them.
- With the OruxMaps Live Track function you will be able to see from Sicami your location and that of the people / friends who have authorized it.
How to activate communication with Sicami?
It will be necessary from Oruxmaps to accept the migration to Sicami.
When Oruxmaps asks you if you want to accept the migration / data communication with Sicami, you must say yes.
In the event that by mistake you say that you do not want to accept the migration, you can go to:
- Configuration -> Integrations -> OruxMaps/SICAMI, then click on Enter OruxMapas / Sicami.
- If you already had an account in Oruxmaps use the "Enter" option
- If you did not have an account in Oruxmaps use the "Register" option
- Accept migration to Sicami
- Enter the necessary data and finish the registration process
- Please check if you receive an email after this in case you need to confirm that you are the owner of that email address.
Possible communication problems with Sicami:
- These credentials do not match our records: The problem is that the username and/or password used are not correct in Sicami.
- User not logged in (or incorrect password): The problem is that the username and/or password used in Oruxmaps is not the same as the one used in Sicami.
- Error 34: The password stored in Oruxmaps does not match the one used in Sicami.
Log out or change password in Oruxmaps.
To close the session or connection with Sicami from Oruxmaps you can do the following:
Automatically upload to Sicami (this will affect all the new routes you save, not the existing ones).
Go to Configuration -> Integrations -> Configuration -> Integrations ->Upload Automatically and check OruxMaps/SICAMI.
- You can select the privacy of the routes you upload and if you want the images to also be uploaded here: Configuration -> Integrations -> OruxMaps/SICAMI
- Note that this will only upload new routes that you record since you have activated these options.
Manually upload to Sicami
You can also manually upload the routes to Sicami, from the list of Track/Routes, clicking on one of them, then on "Properties", menu at the bottom left, "Upload to" and click on "Oruxmaps/SICAMI".
Search routes in Sicami
##publi##
Go to Track/Routes, after this click on the image of your avatar or on the image "S" of Sicami if you do not have an avatar.
The list of routes shown are routes that are in Sicami,
- If you click on one of the routes you can choose between seeing the details of the routes or downloading it in Oruxmaps
- If you click on the magnifying glass you will be able to see the routes directly in Sicami and use the sicami magnifying glass to filter the data.
- When you are viewing the route you want to upload to Sicami, click on "Share" and "Open in Oruxmaps
You can also make a long press on any point on the Oruxmaps map and select the option "Search Routes on Oruxmaps / SICAMI servers" from the menu that will appear.
Places and landscapes that we must visit in the Iberian Peninsula
In this section we will be collecting sites and places that are worth visiting.
Do you know any? contact us to include it.
GR 11 Transpirenaica
The Trans-Pyrenees has a length of about 800 km between the Mediterranean Sea and the Cantabrian Sea on the southern slope of the Spanish Pyrenees.
The itinerary was approved as a long-distance path "GR 11" in 1985.
It can be done on foot, on horseback, or by mountain, gravel or even road bike as there are many variants.
The impressive landscapes that the Pyrenees offer us make this journey very interesting to consider.
But be careful, you have to be careful and plan it correctly, because the weather and the abruptness of the terrain can play a trick on us. Perhaps the infrastructures are not abundant enough to improvise on, for example, where to spend the night or where to replenish provisions.
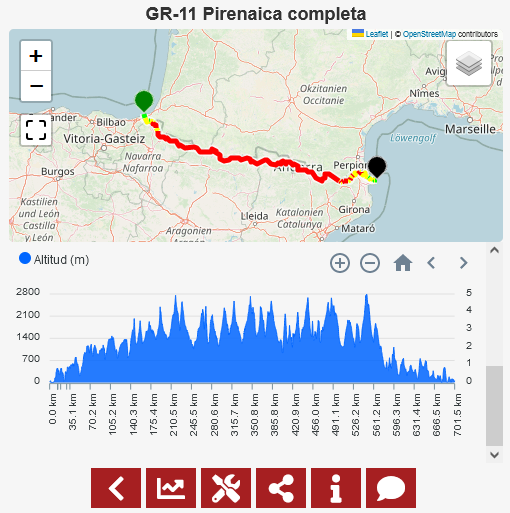
La ruta se ha dividido tradicionalmente en 46 etapas:
Etapa 1: Cabo Higuer - Bera/Vera de Bidasoa
Etapa 2: Bera/Vera de Bidasoa - Elizondo
Etapa 3: Elizondo - Puerto de Urkiaga
Etapa 4: Puerto de Urkiaga - Burguete/Auritz
Etapa 5: Burguete/Auritz - Villanueva de Aezkoa/Hiriberri
Etapa 6: Villanueva de Aezkoa/Hiriberri - Ochagavía/Otsagabia
Etapa 7: Ochagavía/Otsagabia - Isaba/Izaba
Etapa 8: Isaba/Izaba - Zuriza
Etapa 9: Zuriza - Aguas Tuertas
Etapa 10: Aguas Tuertas - Refugio de Lizara
Etapa 11: Refugio de Lizara - Candanchú
Etapa 12: Candanchú - Sallent de Gállego
Etapa 13: Sallent de Gállego - Refugio de Respomuso
Etapa 14: Refugio de Respomuso - Balneario de Panticosa
Etapa 15: Balneario de Panticosa - San Nicolás de Bujaruelo
Etapa 16: San Nicolás de Bujaruelo - Refugio de Góriz
Etapa 17: Refugio de Góriz - Refugio de Pineta
Etapa 18: Refugio de Pineta - Parzán
Etapa 19: Parzán - Refugio de Biados
Etapa 20: Refugio de Biados - Puente de San Jaime
Etapa 21: Puente de San Jaime - Refugio de Cap de Llauset
Etapa 22: Refugio de Cap de Llauset - Refugio de Conangles
Etapa 23: Refugio de Conangles - Refugio de la Restanca
Etapa 24: Refugio de la Restanca - Refugio de Colomèrs
Etapa 25: Refugio de Colomèrs - Refugio Ernest Mallafré
Etapa 26: Refugio Ernest Mallafré - La Guingueta d'Àneu
Etapa 27: La Guingueta d'Àneu - Estaon
Etapa 28: Estaon - Tavascán
Etapa 29: Tavascán - Àreu
Etapa 30: Àreu - Refugio de Baiau
Etapa 31: Refugio de Baiau - Arans
Etapa 32: Arans - Encamp
Etapa 33: Encamp - Refugio de l'Illa
Etapa 34: Refugio de l'Illa - Refugio de Malniu
Etapa 35: Refugio de Malniu - Puigcerdà
Etapa 36: Puigcerdà - Planoles
Etapa 37: Planoles - Santuario de Nuria
Etapa 38: Santuario de Nuria - Refugio de Ulldeter
Etapa 39: Refugio de Ulldeter - Molló
Etapa 40: Molló - Talaixà
Etapa 41: Talaixà - Albanyàv Etapa 42: Albanyà - La Vajol
Etapa 43: La Vajol - Requessens
Etapa 44: Requessens - Vilamaniscle
Etapa 45: Vilamaniscle - Port de la Selva
Etapa 46: Port de la Selva - Cap de Creu
Events
In this section we will be posting events of which we have news. Kedadas, marches, cycling tours, marathons, popular races, etc.
XXXIII Media Maratón de Torremolinos 2023
It will be held on Sunday, February 5, 2023.
Distance: 21km
Departure: 9:30 a.m. from the Ciudad de Torremolinos Municipal Stadium (Málaga)
The Torremolinos City Council, through its Sports Delegation, organizes the XXXIII City of Torremolinos Half Marathon, in which anyone who wants to, federated or not, can take part, provided they meet the requirements, on the day of the test.
101 km de Ronda
https://www.facebook.com/organizacion101kmronda/
Unfortunately we have to announce that by the year 2023 the 101 km of Ronda (Málaga) will not be held since the Legion is carrying out a mission in Lebanon.
The 101 km of Ronda is a foot race that is held annually in the Spanish city of Ronda, in the province of Malaga. The race starts in the center of the city and follows a course through the nearby mountains, offering a breathtaking view of the Andalusian landscape.
The race was created in 2003 with the aim of promoting tourism in Ronda and in the province of Malaga. The idea came from a group of friends who wanted to share their love of hiking and running with others, and decided to create a race that would showcase the beauty of the region and challenge runners.
The race is one of the toughest in Spain, since the route includes several slopes and runs in a mountainous environment. Participants have a maximum of 30 hours to complete the race, and refreshments are provided at different points along the route to help them complete the distance.
The race is held every year in September and attracts runners from all over Spain and other countries. In addition to the main 101 km race, shorter distance races are also held for those who are not ready to run that distance or simply want to enjoy the beauty of the region.
In short, the Ronda 101km is a foot race held in the Spanish city of Ronda that offers a physical challenge and stunning scenery. If you like to run and want to experience a different race, maybe you should consider signing up for the 101 km of Ronda!
La Desértica Almería
As soon as we have news, if it is held, the 2023 edition we will inform you
La Desértica de Almería is a hiking and trail running race that is held annually in the province of Almería, in Spain. The race takes place in a unique environment, the Tabernas desert, which offers a surprising and challenging landscape.
The Desértica de Almería consists of several tests of different distances, from short tests for beginners to ultra-distance tests for more experienced runners. The main race is 70km and runs on a single day, but there are also two-day and three-day options for those who want to challenge themselves even more.
The race is held in the month of April and attracts runners from all over Spain and other countries. Participants have to deal with harsh conditions, such as extreme heat and steep drops, but the beauty of the desert and the camaraderie between the runners make it worth the effort.
In summary, La Desértica de Almería is a hiking and trail running race that takes place in the Tabernas desert in Spain. It offers different distances and a unique environment, and attracts runners from all over Spain and other countries. If you like trail running and want to challenge your body and mind, maybe you should consider signing up for La Desértica de Almería!
The Desértica de Almería also has a mountain bike event, which is held together with the hiking and trail running events. The mountain bike race is a three-day stage race that runs through the Tabernas desert in Almería.
The La Desértica de Almería mountain bike race offers a physical and technical challenge, as participants must tackle long distances, steep slopes and technical terrain. The race is held in the month of April, and the participants have to face harsh conditions, such as extreme heat and strong wind.
The La Desértica de Almería mountain bike race attracts cyclists from all over Spain and other countries. In addition to the competition, there are also options for shorter and less demanding routes for those who want to enjoy the desert on a bike without so much pressure.
In short, La Désértica de Almería also offers a mountain bike race that runs through the Tabernas desert in Almería. The event is a three-day stage race and offers a physical and technical challenge for experienced cyclists. If you like mountain biking and want to experience the Tabernas desert, maybe you should consider signing up for the La Desértica de Almería mountain bike trial!
XIII Carrera Popular 10K del Roscón
https://osandarines.com/secciones-atletismo/
This race marked in recent years by COVID-19, will be held normally again in January 2023.
Date: January 29, 2023
Location: Torre del Agua in the Zaragozano del Agua Park
Distance: 10Km
Quick guide and symbol legend
Youtube videos
Youtube playlist of explanatory mini videos:
Activities and plans
We explain some basic concepts of the use of Sicami.
What are Activities?
The following link explains the main differences between the activities and plans on the Sicami Tracks website.
Information on Activities and Plans .
What are the Plans?
Here we offer you information about the plans
Color a route based on a data.
You can color a route based on a parameter. When you are viewing an activity or plan, from the Tools button  select the "Color Route" option, the route coloring options will be displayed.
For example, you can choose the parameter / value "Heart Rate", then you can choose the range of the three available colors to define which color to show depending on each leg of the route.

This will make you see the route with colors in each section based on your heart rate as shown in the following image:
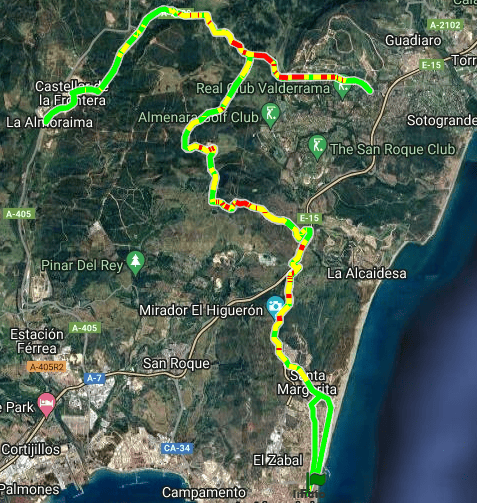
If you zoom in on the map you can see that you will have very interesting information to check how your body behaved on a climb, for example.
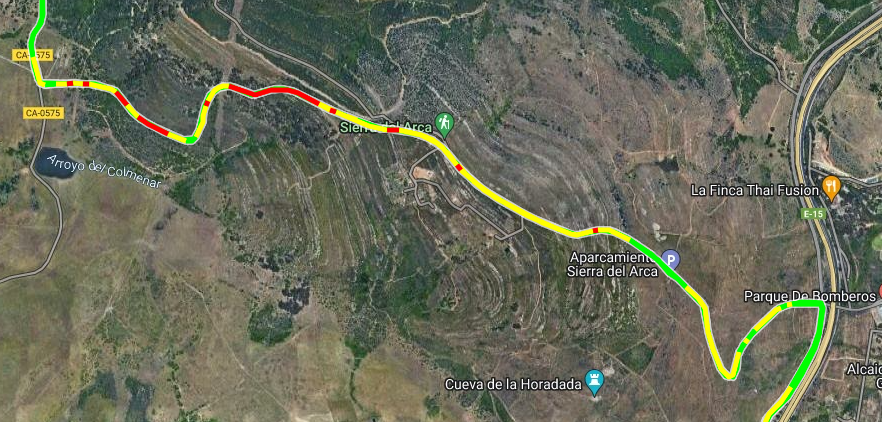
Also on the elevation graph of the route will appear a line with the selected parameter (in example the heart rate)
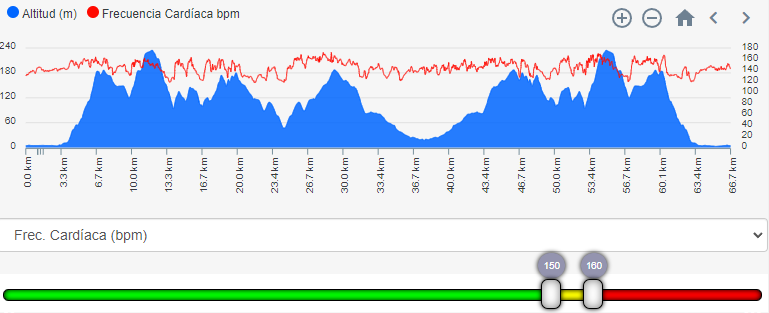
You can make the line of the route be colored based on one of the parameters altitude, speed, slope, cadence, heart rate, power (W), in a short time we will add more parameters.
Stadistics
Stadistics Visualization .
In the stadistics section you will have accumulated and summarized information of all the activities you have carried out.
You can go to the statistics section by clicking this link Stadistics .
How to modify an activity or a Plan.
In the article at this link we give you more information on how to do that. Explanatory manual on how to modify Activities and plans
Add friends .
In the top menu, see the "My Friends" option, from that screen you can generate a link to send to someone and when you accept it, this person will be your friend.
Privacy options.
When you make a route or prepare a plan, you can assign it three levels of privacy / visibility:
Private : Only you can see it
Friends : Can be seen by your friends
Public : Anyone with a Sicami account can see it
In addition, in "My Account" - "Modify my data" you can set a default level of privacy for your new routes and plans
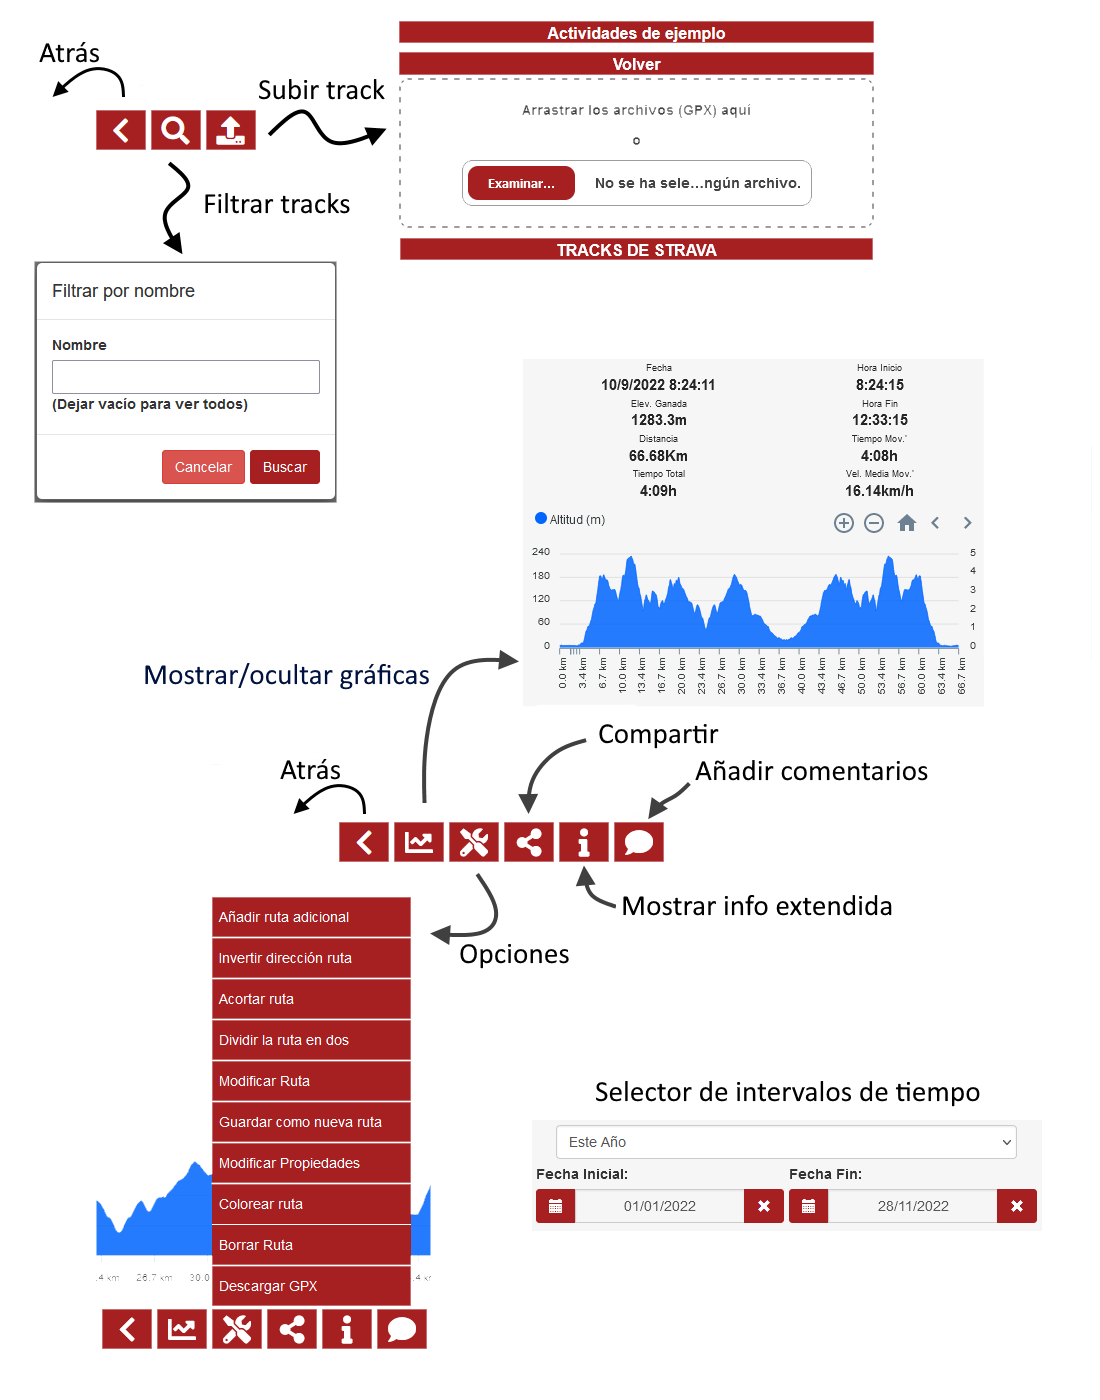
Real Time Map Manual
Location of travel friends
With the real-time map function you can see the location of your friends on the page at all times Real-time Map.
This function can also be very useful when you go out alone, and you want someone with access to your username and password from the Sicami Tracks website to be able to see your location at all times. In the event of any mishap, someone will know where you are, and if you need help you can receive it much faster.
Sicami Configuration
The first thing would be to add friends, you have to go to "More" then click on "My friends" copy the link to send it to whoever you want to be your friend and have them accept the friend request. The other person can do the same and you accept the friendship.
For each friend, the eye button is used to indicate whether or not your friend can see your position on the Map in Real Time. The uncrossed out eye indicates that he can see it, the crossed out eye that he cannot see it.
Share location with Oruxmaps
For your and your friends' location to be visible on the map in real time, you and your friends must use OruxMaps, and it must be configured correctly to share the location with friends. It is the Oruxmaps application that sends your location and that of your friends. Oruxmaps, in addition to sending the location, will receive information about where your friends are and will show it on the screen.
The following link shows how to configure Oruxmaps to share location:
https://tronpoonpo.blogspot.com/2021/07/multitracking.html
The procedure of adding friends from Oruxmaps is not necessary if it is configured from Sicami as we have explained previously.
Choose the visibility of each friend
In the side panel of this page you can select which friends to see and which not.
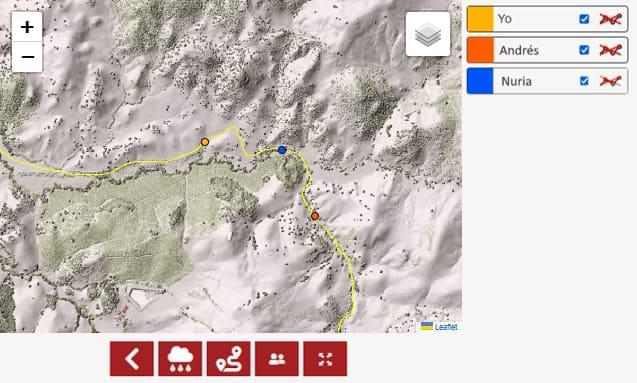
Privacy
Thinking about your privacy, keep in mind that you will only be able to see the location of people who have accepted you as a friend, and also who have authorized you to see their location.
Visibility, ratings, comments and friends
Plan and share
Share your routes with your friends and plan activities with them. It will be more fun, more motivating and it will also provide you with security in the event of any eventuality along the way.
Add photos and comments to your routes, tell about your experience and provide information of interest to all those who want to travel it.
Comments
Find out before making a route by reading the comments and opinions of other users and seeing the rating you have obtained according to the evaluations received.
Knowing the opinion of the rest of the users will allow you to choose the route that best suits your state of form, the time available or the planning of your training.
Rate
Evaluate and score your routes according to your experience and help other users in their planning.

Privacy
When you make a route or prepare a plan, you can assign it three levels of privacy / visibility:
Private: Only you can see it
Friends: Can be seen by your friends
Public: Anyone with a Sicami account can see it
Real Time Map
Puedes utilizarel Real Time Map to know the current location of your companions, so that no one is left behind!

From the real-time map you can select the friends whose location you want to see in the side panel by selecting the ones you want.
The Map in real time is also very useful when you go out alone, without company, and you want someone who has access to your Sicami account to be able to see your location at all times in case they need to help you at any time.
Manual Activities and Plans
Activities
The activities are outdoor sports or leisure actions that you have already done and have recorded using a route recording device or application, it may also be that you have downloaded it from Strava.
Activities vs plans
The difference between activities and plans is that activities are generated from a route recording device or application and plans are generated from a route design application.
Summary of the information
Both in the activities and in the plans you will see a summary of the information of the activity or plan, total kilometers, elevation gain, total time, etc.
Coloring route based on a parameter
See the route colored based on a parameter. You can make the route line color based on one of the selected parameters, altitude, speed, gradient, cadence, heart rate, power (W).
Rate the route
When you view an activity or a plan you can rate it, and depending on the privacy that you have assigned to it, other people will also be able to do so.
Comments
You can also Comment on the activities and plans, and as with the score, other people will also be able to do so depending on the privacy indicated for that activity or plan.
Classify activity or plan
For each activity or plan you can indicate the type of activity to which it corresponds, whether it is running, cycling, mountain biking, etc.
Label activitie
You can label your activities. Create your own labels and add them to the activities to classify them and be able to locate them later. You can assign more than one label to the same activity. Examples of labels would be "With my friends", "Marathon Training", "Highly recommended route", "Don't do it again", and everything that your imagination suggests.
Editing activities and plans
We offer you tools so that you can modify already existing activities and plans and to create new ones . In the article at this link we give you more information on how to do that. Explanatory manual on how to modify Activities and plans
Your privacy is important…
When you make a route or prepare a plan, you can assign it three levels of privacy / visibility:
Private
Only you can see it
Friends
Can be seen by your friends
Public
Anyone with a Sicami account can see it
In addition, in "My Account" - "Modify my data" you can set a default level of privacy for your new routes and plans
When someone other than you views your activity, for reasons of protecting your privacy, both the beginning and the end of the route will be reduced by 400 meters, so that nobody can know your starting and finishing point, which on many occasions can be your home
GPS (Global Positioning System) and other Global Positioning Systems
GPS (Global Positioning System)
It is a system that allows to locate an object that is on Earth with high precision. To do this, the receiving device locates at least four satellites from the satellite network placed in orbit, from which it receives signals that indicate the identification and the time of the internal clock of each satellite. With this information the distance to the satellite is calculated. Knowing the distance to these satellites and by the "trilateration" method, the GPS device can determine the position on the Earth's surface.
With three satellites, the device is capable of determining the latitude and longitude of its position, that is, its position in two dimensions. By adding a fourth satellite, it will also be able to calculate the altitude, obtaining the position in three dimensions. The signals emitted by each satellite form a sphere with the satellite in the center, the point of intersection of all the spheres is what determines the position where the GPS receiver device is located.
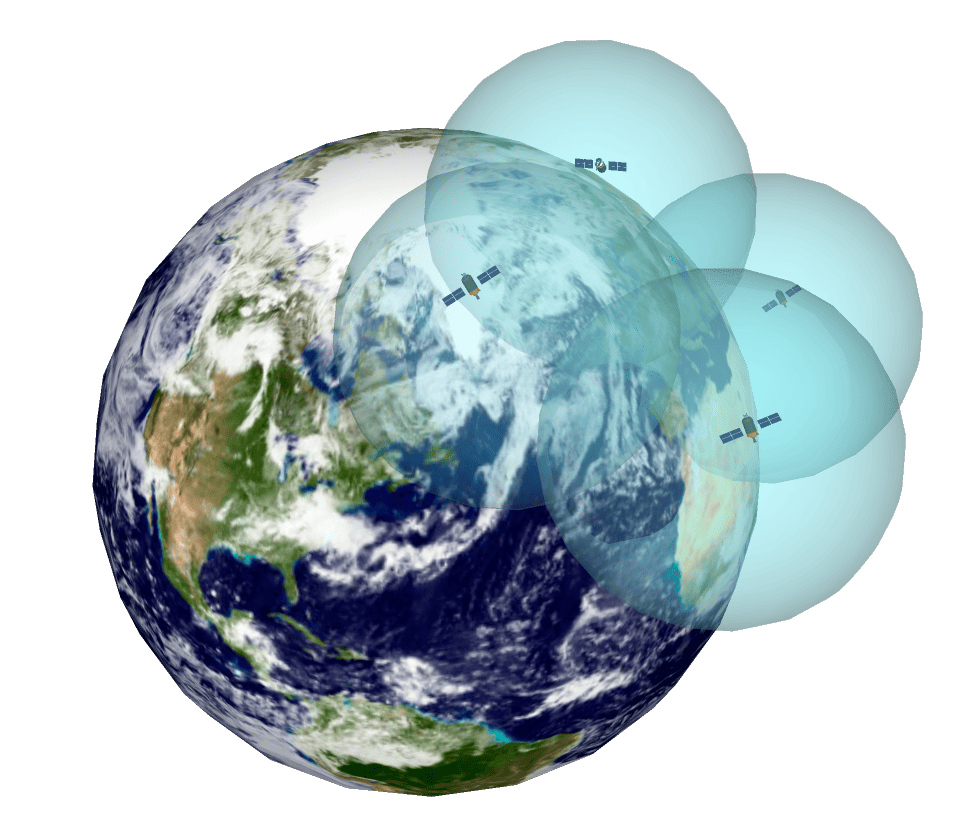
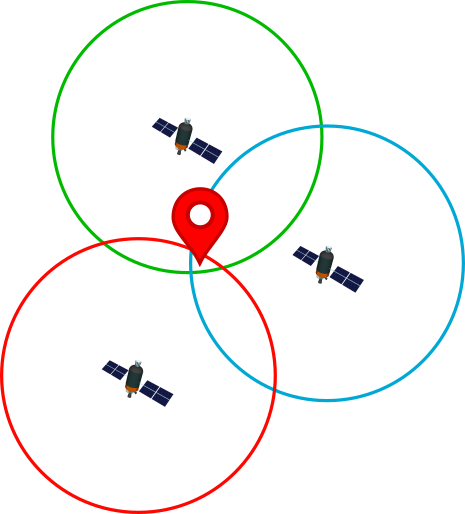
As a curiosity, the satellites transmit on three different frequencies of the radio frequency L band (1000 – 2000 MHz) of the electromagnetic spectrum.
Other Global positioning systems
There are currently four major global positioning systems:
GPS : The best known and currently used is GPS, which is a system owned by the United States Department of Defense and consists of three parts: orbiting satellites, base stations and receivers. Its coverage extends to the whole world. Its real name is NAVSTAR (Navigation Satellite Timing and Ranging).
GLONASS (GLobalnaya NAvigatsionnaya Sputnikovaya System): It is Russia's state-owned positioning system and also has worldwide coverage.
Galileo : Galileo has been developed by the EU as an alternative to GPS and GLONASS.
BeiDou : It is the system created by China and has worldwide coverage although it offers greater precision in Asia and the Pacific. BeiDou means Big Dipper in Chinese.
There are also other systems, although their coverage is only regional, such as the NavIC system in India or the QZSS system in Japan.
Tips for a safe route
First of all, we have to clarify that these recommendations are not incompatible or exclusive with any other guide or advice for the good hiker / cyclist. Each measure collected here must be looked at through the magnifying glass of the context of the route. For example, a recommendation of the type "travel light" loses steam when you have to stay overnight for more than one day.
1º Wear appropriate clothing. It seems quite obvious, but the calculation of how warm the clothes should be is not so obvious. Checking the weather the day before departure can be a great ally, especially if the starting point of the route is quite far from your home and temperatures can vary. In general, comfortable and light clothing if the cold allows it is usually the best. There are so many possible options and combinations that we are not going to stop to break them down here, but a garment that is common to hikers and cyclists, and is usually a great comfortable-thermal panacea is the windbreaker.
2º Take hydration and enough food. This is the only point that we must allow to clash with comfort, since dehydration is one of the most serious dangers that beset hikers of all kinds. Do not get us wrong, the liquid container must be comfortable to carry, but you must not skimp on the content, which must be, as we say, always more and not just. Almost all of the world's natural sources of water are unfit for consumption, be it from human waste or cattle feces, so the last thing you want if you have a problem in the forest is having to drink from a river or pond. . The food, on the other hand, must be highly nutritious and if possible caloric. If you lose yourself, it's not the best time to diet.
3º Choose the weight and the backpack well. If you are taking your first steps doing routes, I know what you are thinking. No, do not take your college/university backpack on a field trip. These "academic" backpacks are designed to carry books, so they distribute the weight poorly when it is made up of what you need for a cycling or trail route.
The general rule of thumb here is: wear the smallest pack possible as close to your body as possible without “dancing”. What is strictly necessary for the route will vary depending on its duration and location, but we emphasize here that you have to bring extra hydration. What we can say is what is not strictly necessary and should be left at home for comfort: headphones, speakers, cameras, board games, consoles (yes, we know of cases of people who have taken them on excursions), liquids that they do not hydrate (carbonated drinks, alcohol…) or non-nutritious foods.
4º Do not travel alone. Travel with at least one other person. This is especially important in environments far from civilization, since in the face of a crippling injury, being alone can be disastrous. The countryside and the mountains are not something to be taken lightly, even the forest rangers, so expert on the trails, make them go in pairs. Because of his position, the traveling companion should be a trustworthy person and, if possible, with a better sense of direction than your own.
5º Familiarize yourself with the route beforehand.Before leaving, it is imperative that you do a little study of the area, the possible dangers, temperatures and, above all, the map to follow. You must not follow routes of dubious reliability or that issues may cross protected areas without authorization or private farms. Of course, the source of information on the ground must be reputable and doubtful, as far as possible, of inexperienced hikers and cyclists. Also familiarize yourself with the different types of signs and beacons. If it is a trail route, it looks for the "wind markers" that, with total certainty, other hikers will have placed. A small clarification here on a subject that in its day makes all novices doubt: private hunting reserves can be crossed, as long as another law does not prevent it, since they delimit a private area for hunting,
6º Do not leave the path. Whether by bicycle or walking, the traffic of other hikers and/or animals will have left a noticeable mark, not to say bald, on the ground. This is the path or path to follow and no other. Not only because it is probably the shortest option, but because when you leave you will be adding additional obstacles, crushing vegetation for no reason and, probably, disorienting future hikers who will be suffering from your new "route". All this takes on a special aspect if we are talking about an environment with protected species, crushing which can lead to economic sanctions.
7º The mobile must be an ally, not an enemy.The mobile and route tracking applications, such as OruxMaps, are a wonderful tool that allow you to calmly take a route through even the most unknown of places for one. But the dependence on the phone should not be abused, especially considering that they have limited batteries. Our recommendation here is that if your mobile has what is commonly known as a "cascaded battery", do not venture with it as the only mapping tool in an unfamiliar environment. The battery, in this case, must be long-lived and not open to surprises. The tracking of the route is a function that consumes the battery of a mobile phone moderately quickly, so if you have doubts about whether it will last you or not, just follow the map route with it, without tracking the route.
Plans Manual
A plan is not the same as an activity, activities are outdoor sports or leisure actions that you have already carried out and have recorded using a device or application for navigation and route recording, it may also be that you have downloaded it from Oruxmaps or Strava. On the other hand, a plan is a route that is created or generated using an application for route design, such as Sicami or any other app.
In other words, when a plan is created, it does not correspond to any activity actually carried out, it is created precisely to be used later in a real activity.
The most common is that a plan is created to later upload it to a device or application for navigation and route recording to use it as a route to follow.
The plans will help you plan your future routes correctly, they will allow you to discover the most difficult sections, for example because of their steep slope, you can also see in advance where to plan a rest stop, or to eat.
You can start preparing your plans in this link Plans that will take you to the Plans section.
Geographical coordinates
Geographic coordinates
Spherical angular coordinate reference system to represent locations on earth. At least three values will be needed to represent a location: one for the horizontal position, one for the vertical position, and a third indicating the distance to ground level, which is identified as sea level. The values of horizontal and vertical position are usually given in sexagesimal degrees, since these are angles whose center is the Earth.
Meridians and parallels
The terrestrial sphere is divided with imaginary lines called meridians and parallels .
Meridians
Meridians are lines that run from the North Pole to the South Pole. The prime meridian, zero meridian or Greenwich meridian is the imaginary line that joins the north and south poles passing through the town of Greenwich in England, the rest of the meridians take this as a reference. To the east the meridians are taking positive values up to 180º while to the west the values taken are negative.
Parallels
Parallels are lines from east to west, are perpendicular to the north-south axis and are parallel to the Equator. The equator is parallel "0".
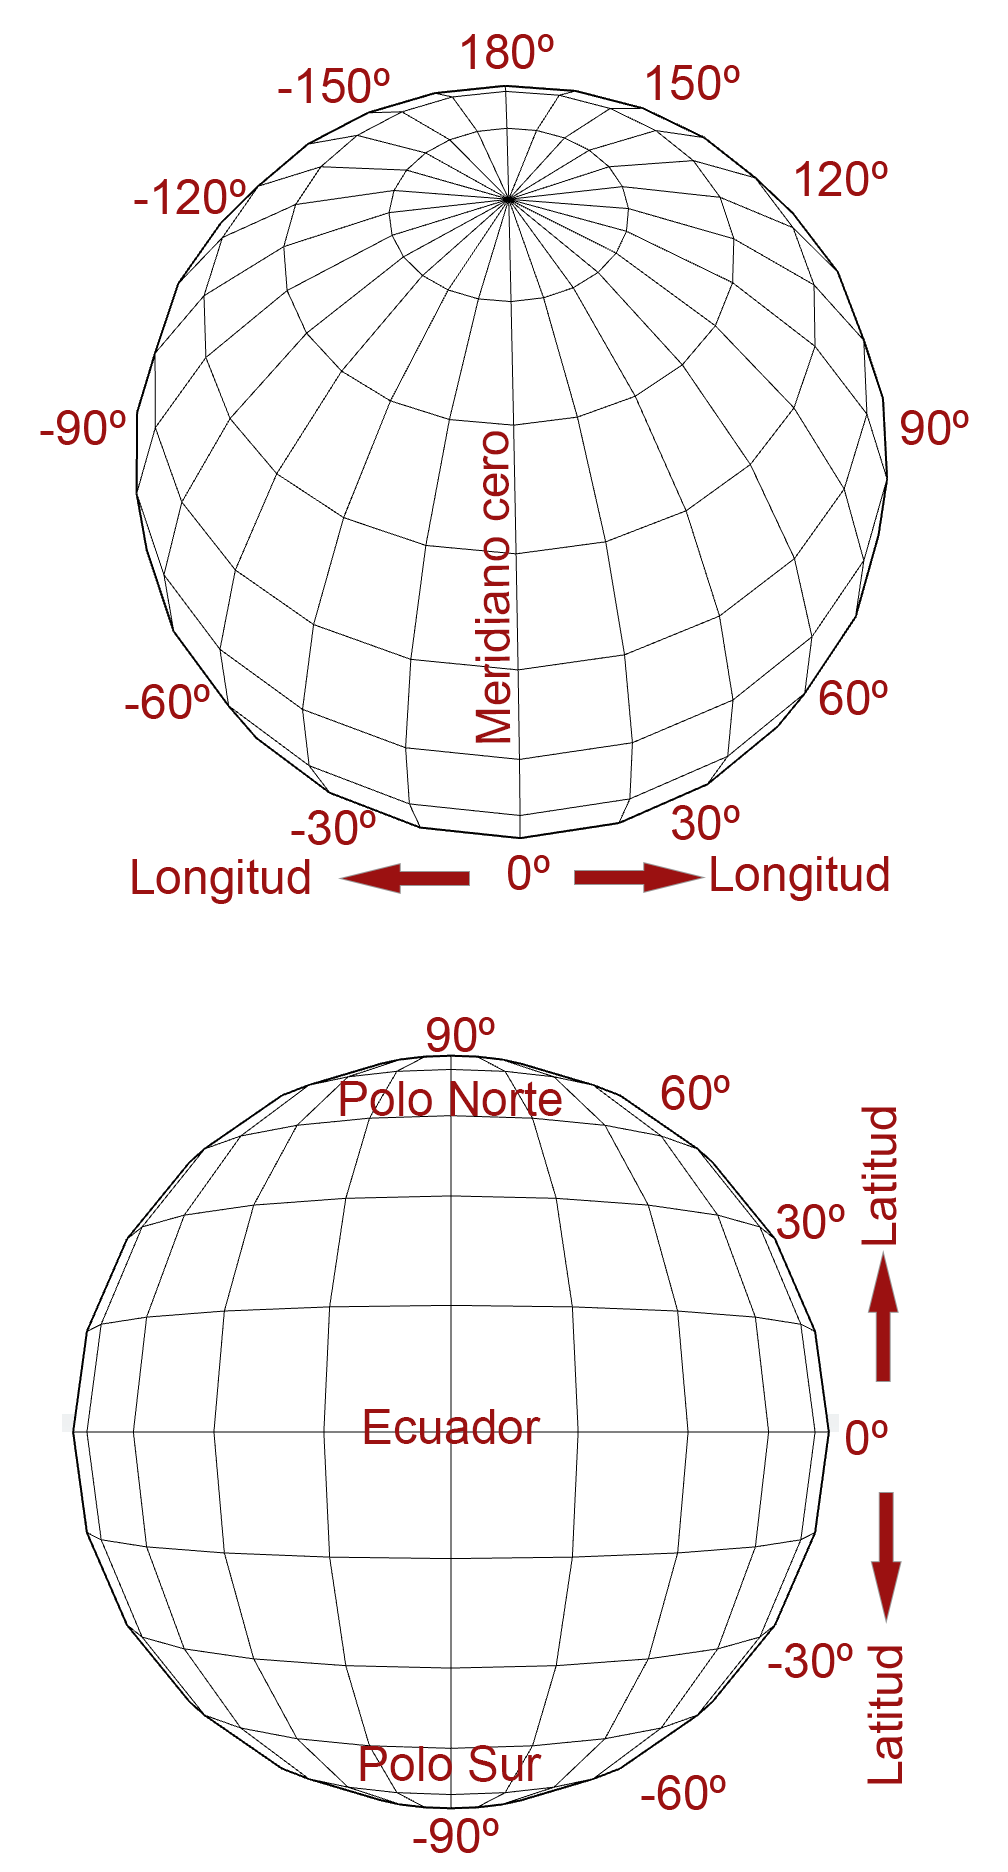
Latitude y Longitude
Latitude
The latitude of a point on the earth's surface is the angle between the plane passing through the equator and the line passing through the point and the center of the earth. All points with the same latitude form imaginary circles that are "parallel" to each other and parallel to the equator, which is the larger of the "parallels."
Longitude
The longitude of a point on the earth's surface is the angle between the plane passing through the Greenwich meridian and the plane of the meridian passing through the point. All points with the same length form semicircles that pass through the poles similar to the segments of an orange.
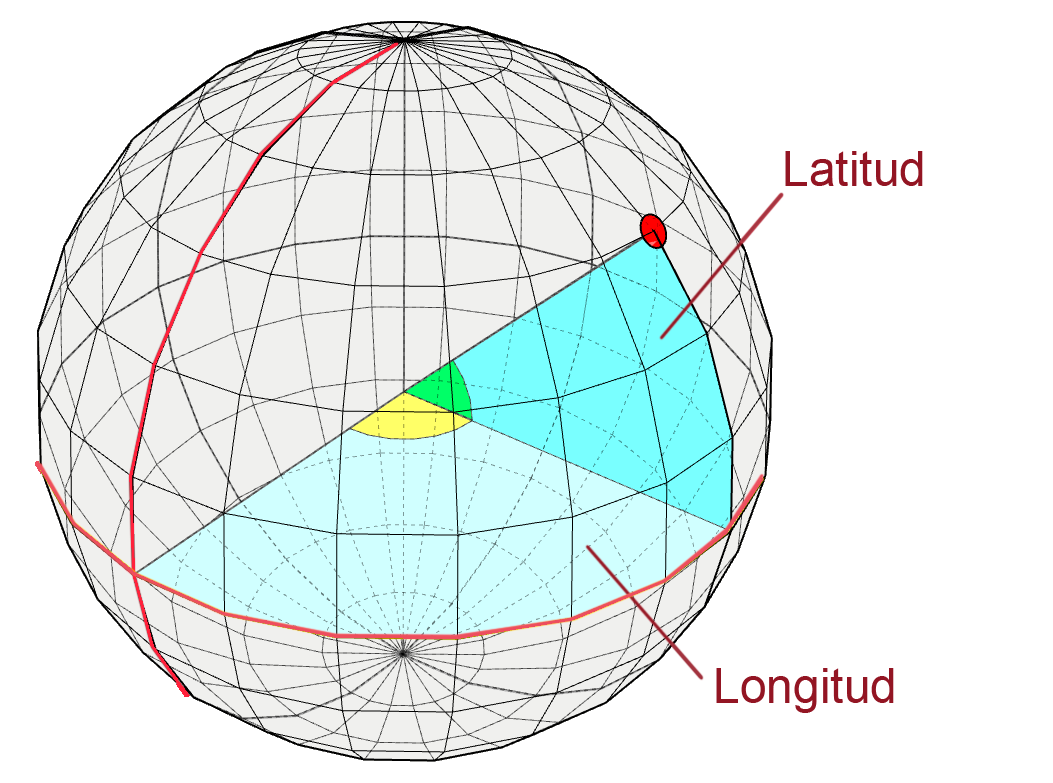
Basic notions on map interpretation
Representation of geographic data in two dimensions, contour lines
Isolines are used to represent the distribution of a variable (temperature, atmospheric pressure...) on a surface. The isolines are lines that join points with the same value on the surface, the value can be the one that is chosen, temperature (isotherms), pressure (isobars), precipitation (isohyets).
The isolines that join points of equal altitude of the terrain are known as "contour lines" and allow the representation of the terrain surface in two dimensions.
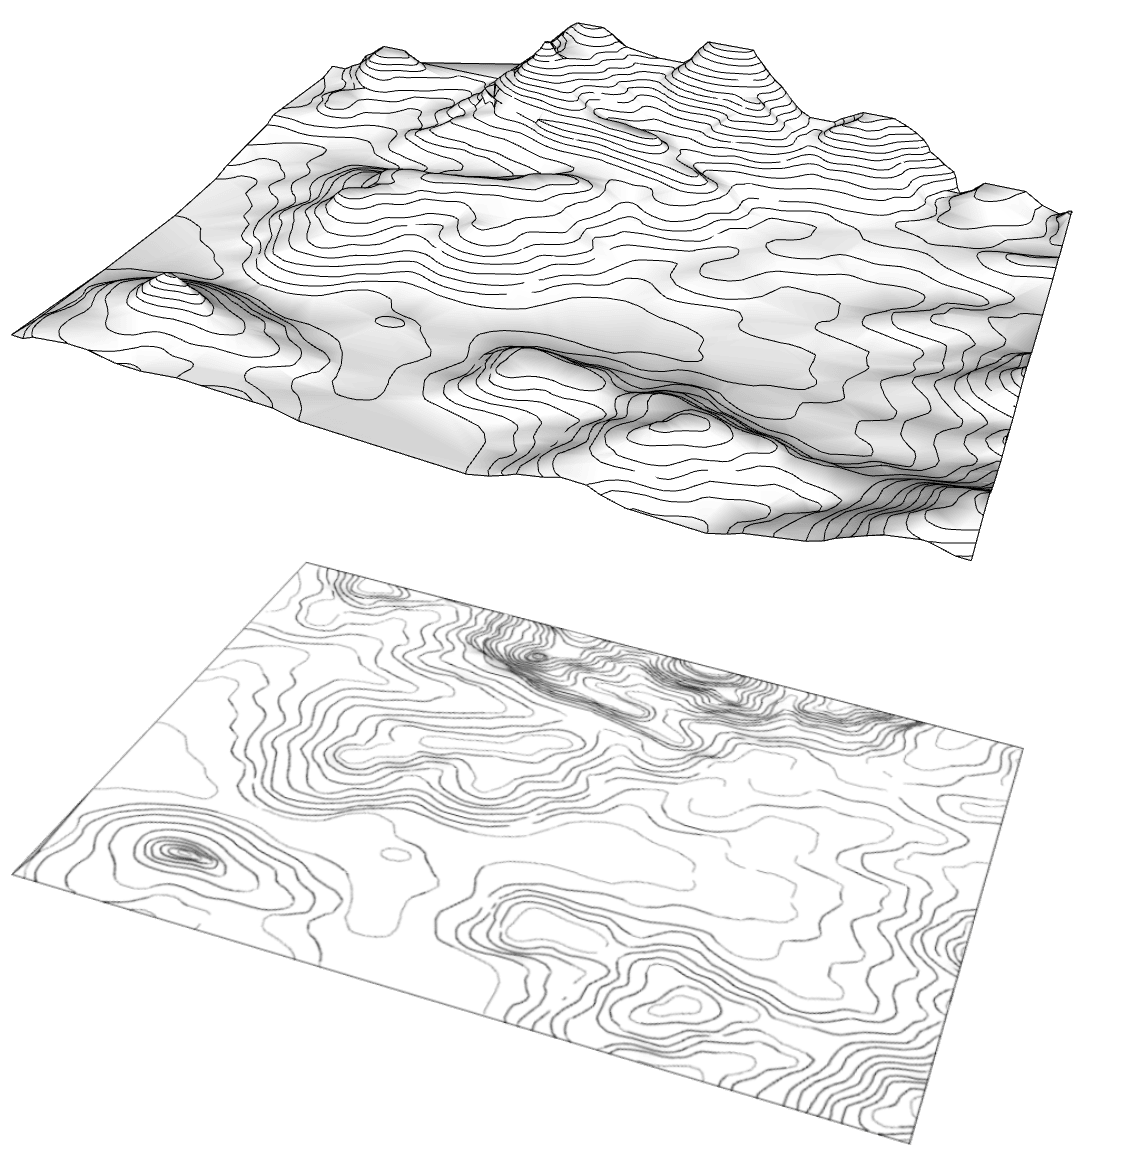
Types of contour lines
On cartographic maps we will find two or three types of contour lines represented, normally in brown.
Contour lines
Are the thinner lines.
Master contour lines
Are thicker lines.
Auxiliary contour lines
Are thinner Dashed Lines
Additional numerical information
Master curves display a number that represents the absolute value of altitude along that line. The numbers are oriented so that the top of the number indicates which way the altitude value increases.
If between two master lines, for example 900 and 950, we find four level curves, these will divide the space into 5 parts and we will interpret them as the intermediate values between 900 and 950, that is: 910, 920, 930 and 940.
If a master line does not have an indication with a number, probably due to lack of space in the visualization, we will interpret that it follows the same interval as for the rest of the master lines.
The summits or tops are the points of the terrain of maximum relative altitude and are also shown on the map. In the following example we can see that there are several summits (indicated by a dot and numbers in black) of 999, 984, 883, 887, 1051... meters.
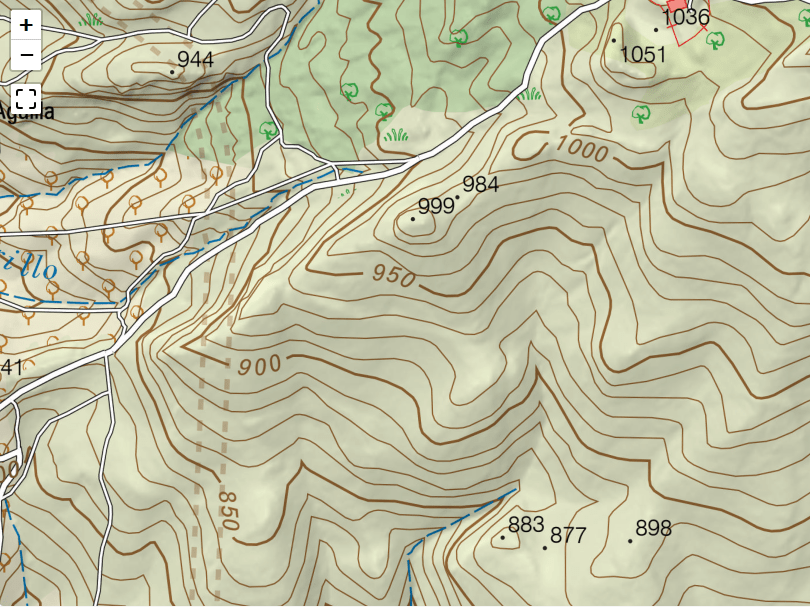
More information
The gradient
The gradient or degree of variation of the altitude is always perpendicular to the contour. When the lines are very close to each other, they indicate that the altitude variation is very fast, which means that the altitude increases or decreases sharply.
The distance between contour lines will depend on the scale of the map and is usually between 50 and 100 meters for the main lines and between 10 and 20 meters for the intermediate (thinner) lines.
The scale
the scale of a map indicates the equivalence between the real distance and the distance represented on the map. For example, a scale of 1:10,000 means that one meter on the map equals 10,000 meters in reality, or that one centimeter on the map equals 10,000 centimeters in reality. Larger scales will cover more of the terrain but the detail will be less.
The legend
If the map has a legend or documentation of the symbols used, it is convenient to review it as it will provide us with a lot of information about the units of measurement used, the colors, orientation, scale and elements represented.
In the map of the previous image we can see that there are some non-permanent streams or rivers marked with a broken blue line.

also an olive grove on the left bank, below (at a lower altitude) a leafy area and scrub areas.


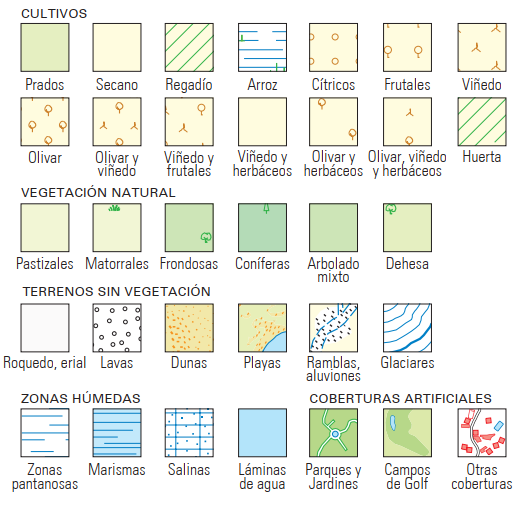
Magnetic Declination
Magnetic declination concept
The magnetic field generated by the Earth is not immutable, on the contrary, it constantly varies both in its position and in its intensity and also periodically (in cycles of thousands of years) it is reversed. Currently, he travels about 100 meters a day.
Since a compass will always indicate the magnetic north pole, it is convenient to know the relationship or difference between the north indicated by the compass and the true or geographic north. This concept is magnetic declination.
Magnetic declination (“variation” in aeronautical navigation) is the angle between true (geographic) north and magnetic north, that is, it is the difference angle between geographic north and the north that a compass will mark.
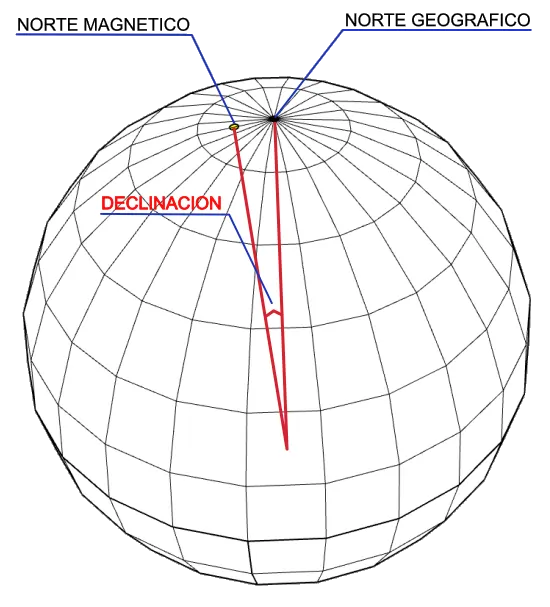
The magnetic declination will depend on the position on earth from where it is measured, being zero at the point on earth where they are aligned.
The following figure shows the declination for three points A, B and C located in different positions on the earth's surface. For point C the declination is zero since it is aligned with the geographic north pole and the magnetic north pole.
Declination is considered positive if magnetic north is east of true north and negative if magnetic north is west of true north.
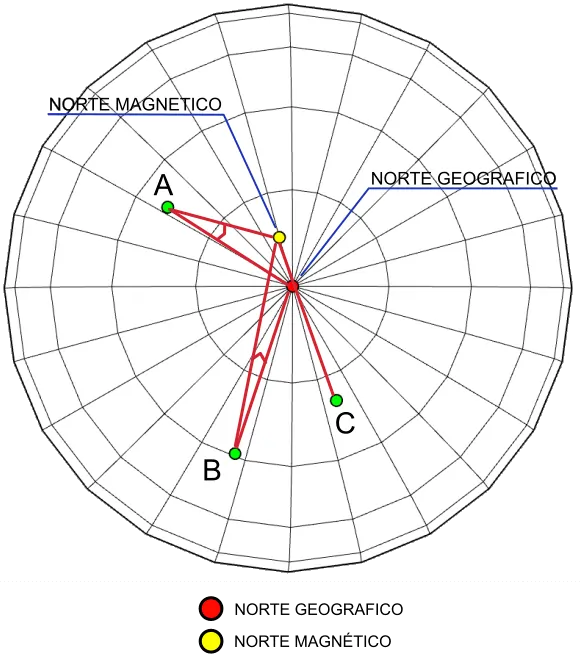
Magnetic declination maps
In order to know the magnetic variation at any point on the planet, maps are made where the magnetic declination at each location is indicated by means of isolines that represent a specific angle, since they are isolines that represent angles, they are called isogonas. Once our position or the position of the route is known, the closest isogonic line to our position will be taken as a reference.
The special isogonic line that joins points of variation “0º” is called agonal line (without angle). A compass located in a position corresponding to an agonal curve points exactly to true north, since its magnetic declination will be zero.
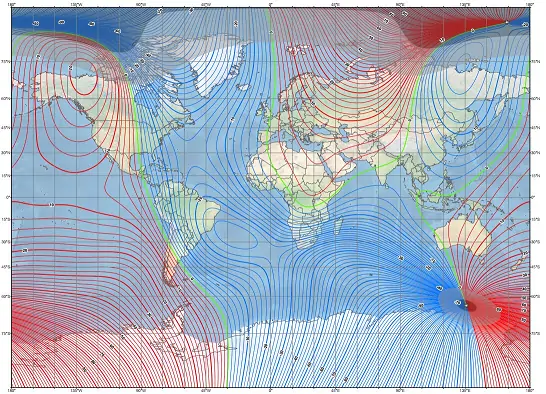
Map developed by NOAA/NCEI and CIRES
https://ngdc.noaa.gov/geomag/WMM
Published December
Types of Maps
Types of maps. Classification criteria
Maps can be classified according to different criteria, in our case we will classify them according to the content and mode of representation.
Maps by content type
Depending on the mode of representation of the terrain we can distinguish between
Raster maps
Raster maps consist of georeferenced images, that is, it is an image file to which coordinates are assigned so that it is displayed in the correct location when opened with an application. They can be built with standard image formats (jpg, bmp...) accompanied by a calibration file, although there are specific formats for digital cartography
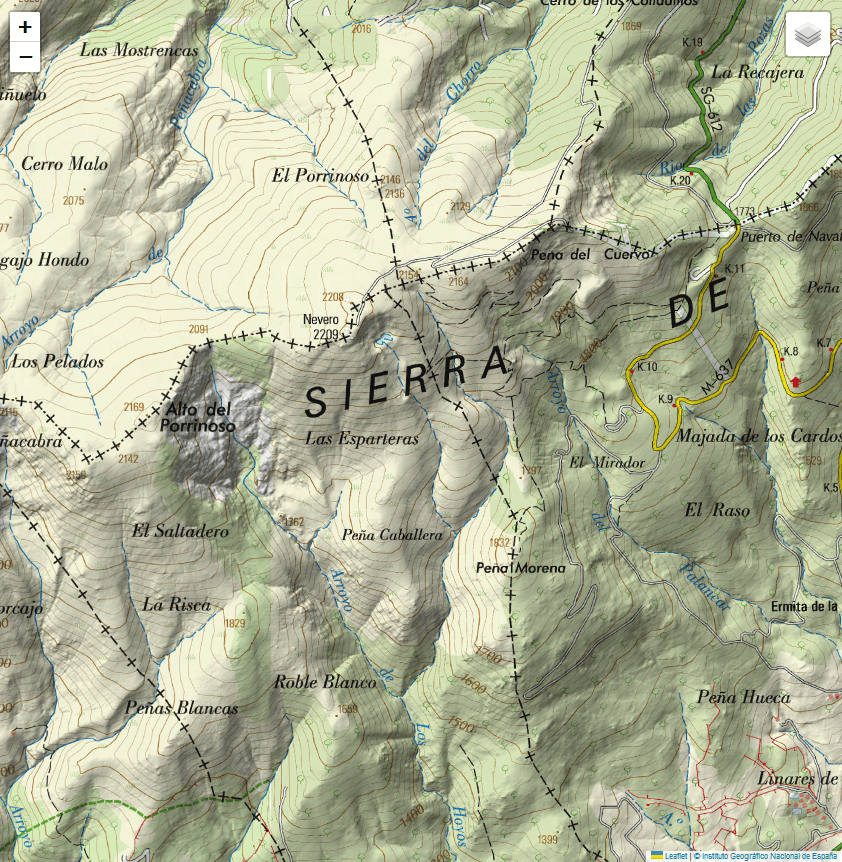
Maps of this type can take up a lot of space in memory, so they are usually available as mosaic maps in which the entire map is divided into smaller pieces (tiles) to handle only the parts of the map corresponding to the area to be viewed. use.
Vector maps
This type of map is composed of vector objects such as polylines, polygons or points that contain additional information such as color, labels, type of terrain. These elements and other information will be arranged in layers that will be displayed based on the display options setting or zoom level. These maps may contain information that allows an application to automatically calculate routes.
DEM: Digital Elevation Model
They are maps that contain only information about terrain altitude. They will normally be used in combination with another map to render it in 3D and assign altitude to route points and waypoints. (See section "Information on data calculation methods" on this site)
Maps according to the mode of representation of the terrain
Depending on the way the terrain is represented, we can distinguish between:
Topographic maps
Raster or vector map that represents the terrain using contour lines, colors and graphic symbols to show information about the area such as geographical features, roads, trails, sources...
Orthophoto
They are raster maps consisting of aerial images of the terrain with orthogonal projection (perpendicular to the surface). To avoid distortions due to the point of view of the camera, the aerial photographs are rectified to adapt them to the shape of the terrain.
Road maps
These are vector maps especially oriented to urban and interurban navigation. Useful elements for the motorist or road user are highlighted.
Cartographic projections
Carthographic projections
A map is a two-dimensional representation of the earth, which has three dimensions, the transition from a three-dimensional representation to two dimensions is known as a projection.
In order for there to be a correspondence between the points on the curved surface of the earth and those on the flat surface of a map, a grid is used with x and y coordinates obtained from the longitude and latitude coordinates through different mathematical calculations. This causes that there is inevitably a deformation when making the projection, so it will be depending on what parameters we want to read (distances, surfaces or angles) that one or another of the available projection systems will be used, making a projection that correctly represents impossible. all three simultaneously.
Based on this we can distinguish three types of projection
Projections according to conservation of distances, surfaces or angles
Equidistant projection:
where distances are preserved
Equivalent projection:
where surfaces are kept
Conformal projection:
where the shape or relationship of angles between points is preserved.
To improve the result of the projections, geometric surfaces can be used that will later be lowered in the plane. Let's see some of the most common:
Projections on geometric surfaces
Cylindrical projection.
It is obtained by placing a tangent cylinder to the terrestrial sphere at Ecuador. The Mercator projection is the best known cylindrical projection. The meridians and parallels will be perpendicular in the projection, the distance between the parallels will increase as the latitude increases. This will produce a larger deformation the further away the north or south position is from the Equator. The Equator will be the only line where the scale will be preserved. The territories and countries located further north will appear larger than life and the poles are not represented as they would be at infinity. Although this system causes the areas near the poles to be greatly distorted, it is useful for navigation since it is a type of "conformal" projection, that is, it preserves the angular relationship between points.
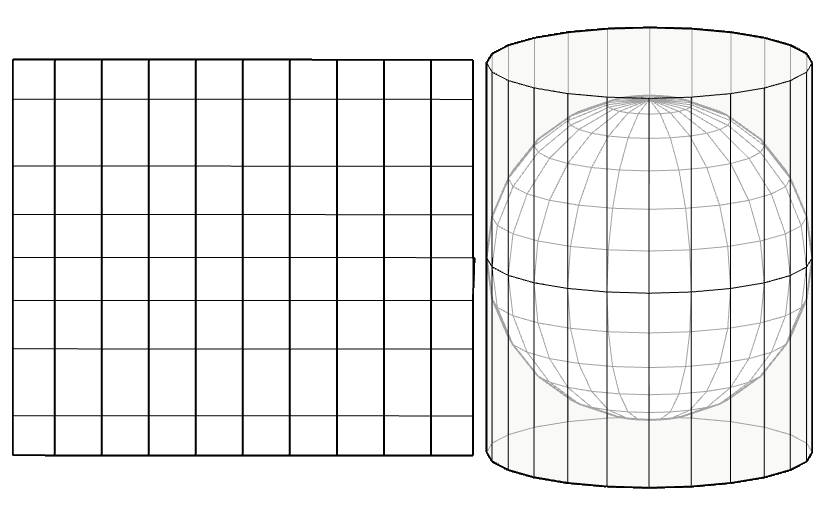
The Transverse Mercator projection
The Transverse Mercator projection is a variant of the Mercator projection where the meridians are expanded to the east or west of the Greenwich meridian. The meridians are represented by curved lines parallel to each other and convex towards the equator. In this case, the distortions are greater the further away the position is from the Greenwich meridian and this will be the only line where the scale will be preserved.
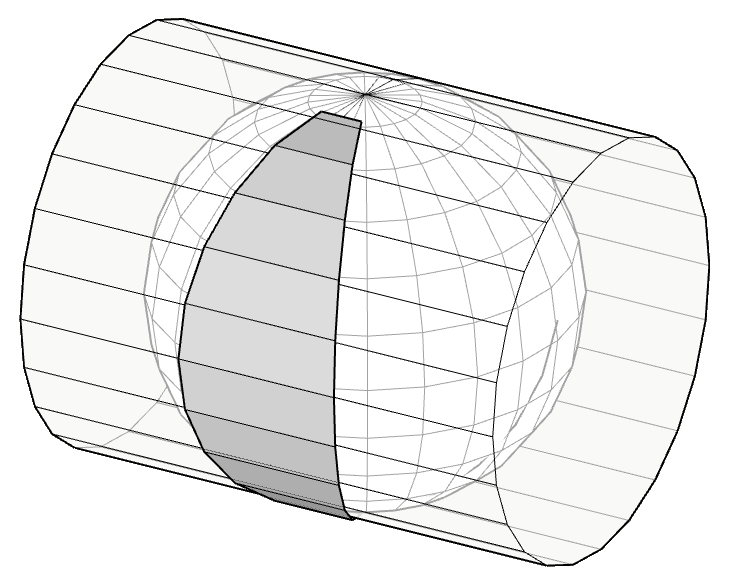
The Universal Transverse Mercator Projection (U.T.M.)
The Universal Transverse Mercator Projection (U.T.M.) is another projection system, based on the transverse projection, which divides the globe into 60 sectors or zones along the Equator (each sector covers 6 degrees of longitude). Each zone has a central meridian and the intersection of this central meridian with the Equator is established as the "x" and "y" origin of the zone.
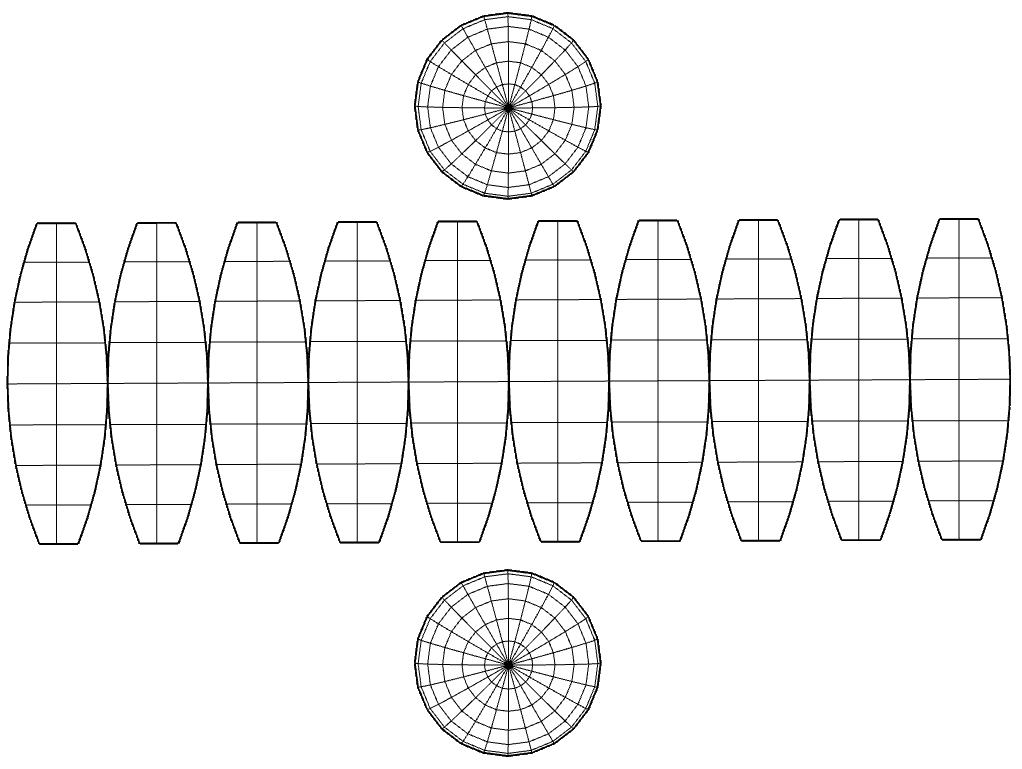
Conical projection
Meridians and parallels are projected onto a conical surface tangent to the vertex of the cone on the axis formed by the poles. The meridians will become straight lines starting from the pole and the parallels will become concentric circles centered on the poles.
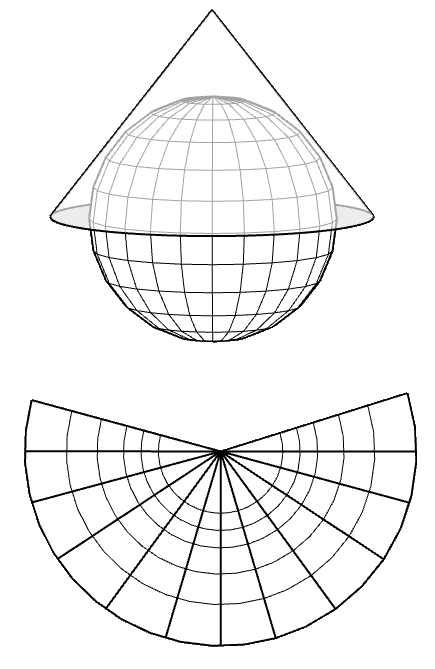
Clouds
Types of clouds according to their shapes, colors and altitude.
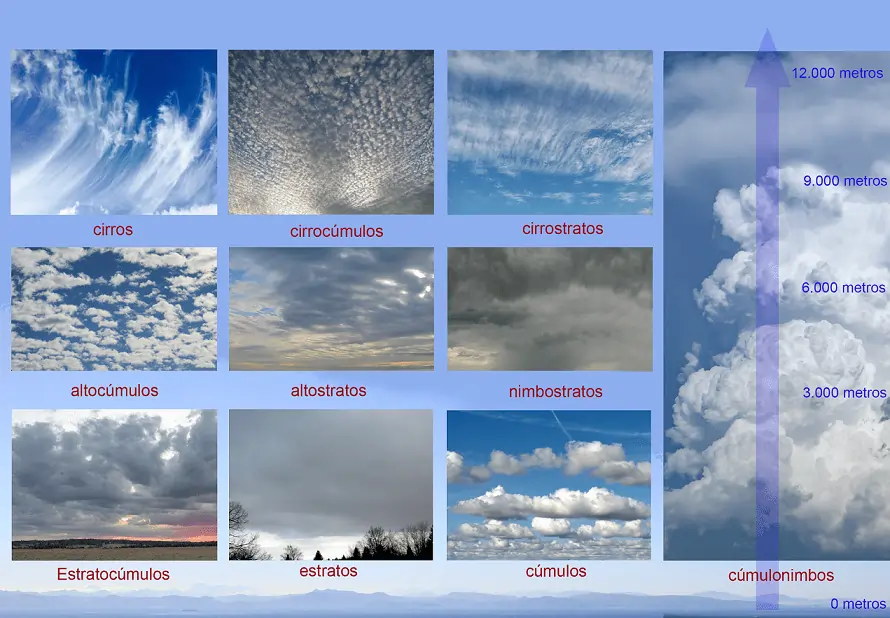
High clouds (above 6,000 meters)
Cirrus clouds:
White, somewhat transparent, do not have interior shadows or cast a shadow on the ground. They form long, thin filaments, sometimes aligned like tufts of hair. They are formed mostly by ice crystals and usually produce halos with the sun or moon. With few and fine cirrus clouds, the weather will be stable, but it will probably tend to get worse if they begin to acquire volume and density.
Cirrocumulus:
Similar to cirrus clouds but more dense, forming an almost continuous layer with rounded shapes. They also do not have interior shadows and are completely white. They usually anticipate the arrival of a cold front. They can also form halos.
Cirrostratus:
Appears as a white and transparent layer like a veil that covers part of the sky without a clear structure. They usually present elongated striations of a certain width. They form halos. They usually appear before a large increase in cloudiness and worsening weather.
Medium clouds (between 2,000 and 6,000 meters)
Alto cumulus:
They are white and bluish gray. With inner shadows. They are made up of water and ice. They are denser and more compact and have a varied appearance, lenticular, globular, stratiform. They do not produce precipitation, but anticipate the arrival of bad weather due to storms.
AltoStratos:
Forms a translucent gray or bluish sheet with dense clouds mixed with finer areas. They allow the passage of the sun that will appear as a luminous disk. They are usually a harbinger of fine rain and a drop in temperature.
Nimbostratus:
Dark gray in color with more or less opaque areas. They block the sun completely. They give precipitation with a high probability of light or moderate character, both rain and snow.
Low clouds (between 0 and 2,000 meters)
Stratocumulus:
White in color with gray areas of different intensities. Large size and notable vertical development. These types of clouds do not usually cause precipitation.
Strata:
Gray in color and poorly defined, it looks like fog since they are low above the ground and can cause a light drizzle.
Cumulonimbus:
They are clouds of great vertical development, being able to cover from the lowest level to the highest. They are dense and their upper part sometimes extends into a large plume, the lower part being dark in colour. It usually produces showers and electrical storms. It is made up of large water droplets and ice crystals on top.
Cumulus:
Large in size, flattened at the base and with large bumps at the top. White color with abundant leftovers. They tend to be typical in stable and sunny weather and do not present a risk of precipitation although they can grow to form cumulonimbus clouds when there are strong updrafts and high humidity.
Altitude, Height and Elevation
Altitude, Height and Elevation
It is common to use the terms altitude and height interchangeably to refer to a location. Next we will recall the definition of these terms.
Height is the vertical distance of a body from the earth's surface (the ground or the sea).
Altitude is the vertical distance of a body from sea level, regardless of whether the object is on the earth's surface or above it (plane, drone, ...)
Elevation is the vertical distance to sea level of a point that is on and in contact with the Earth's surface.
In the following graph, we see that the green point is located at a certain altitude and at a certain height, while the yellow point on the ground surface is at a certain altitude, but its height is zero since it is touching the ground. The land on which it is located is at a certain elevation.
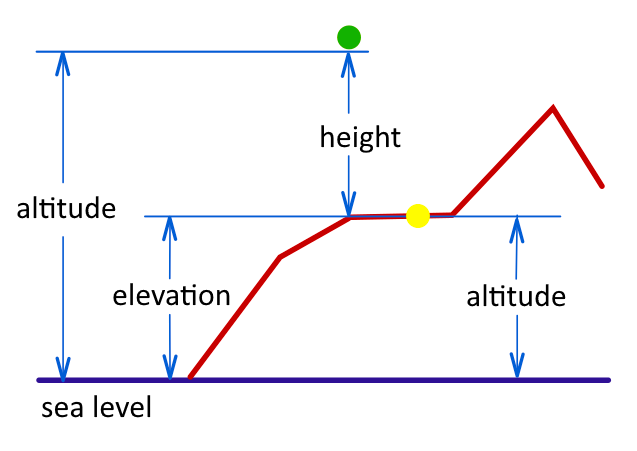
In certain cases the values may coincide, although we will be referring to different concepts. For example, for the yellow dot the elevation matches the altitude and if the body were flying over the sea, its altitude would match its height.
Unevenness and slopes
Unevenness and slopes of a route. Positive, negative and accumulated unevenness.
The difference in level, by definition, is the difference in height between two or more points. The zero level point will be the point where we start the route, regardless of the height of that point at sea level.
The accumulated difference in altitude will be positive if the final height is greater than that of the starting point (we have accumulated meters by ascending) and negative if the final height is less than that of the starting point (we have accumulated meters by descending). If the starting point and the end point coincide, the accumulated difference will be zero.
Strictly speaking, to calculate the accumulated gradient of a route, we will add the positive gradient and the negative gradient. For example, on a circular route that climbs a 500-meter pass and has the same departure and arrival point, the positive difference in altitude will be 500 meters and the negative difference in altitude will be another 500 meters, so the accumulated difference in altitude will be 1000 meters. On any route with the same starting and finishing point, the positive accumulated gradient will be equal to the negative accumulated gradient.
As the routes usually do not usually only go up or down, but there are concatenated ascent sections and descending sections, the positive accumulated difference will be the sum of all the height gains and the negative one will be the sum of all the height losses. Therefore, it will not coincide with the height gained or total altitude gain, which is the difference between the highest level and the lowest level of the route.
Example: We leave point A with an altitude of 500 meters above sea level and end at point F with an altitude of 600 meters above sea level, passing through intermediate points B, C, D and E.
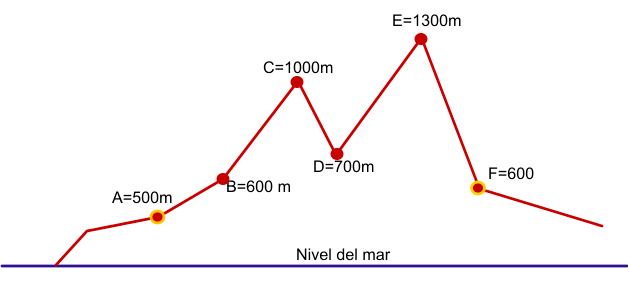
We add all the altitude gains in the ascending sections:
A-B: 600-500 = 100
B-C: 1000-600 = 400
D-E: 1300-700 = 600
Positive cumulative difference: 1,100 meters
We add all the altitude losses in the descending sections:
C-D: 700-1000 = -300
E-F: 600-1300= -700
Negative accumulated gradient: -300 – 700 = -1,000 meters
Total accumulated slope: 1,100-1000 = 100 meters.
In cycling, when we talk about “accumulated slope”, we usually refer to the positive slope, as it gives a better idea of the difficulty of the route.
Slopes of a track
To determine the difficulty of a route, as important as knowing the unevenness is knowing the slopes of the different ramps. The slope is the relationship between the distance ascended vertically and the horizontal distance traveled to ascend it. A quick and simple formula to calculate the average slope of a section would be the following as long as the vertical distance and the horizontal distance to the point of ascent are known:
Slope (%) = Vertical distance x 100 /Horizontal distance
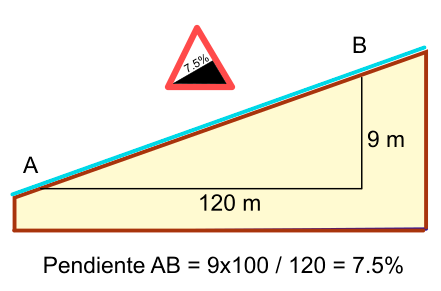
According to known data: distance traveled, elevation angle, vertical distance, etc. There are other methods in which trigonometric calculations are applied.
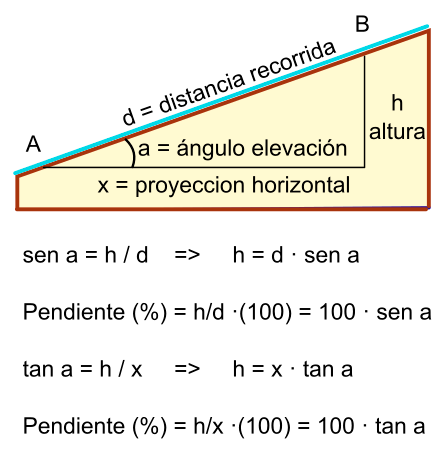
Modify and Create Activities and Plans Manually
Introduction
Load your gpx files, be they activities or plans and edit them on the map, add waypoints indicating significant places, add useful comments for your friends.
Track editing also allows you to trim a route, invert it (make the iend of it become the start), join two routes, add or remove coordinate points.
Create new routes from scratch, starting from an existing one or joining other existing routes.
The following image shows how to activate route editing:
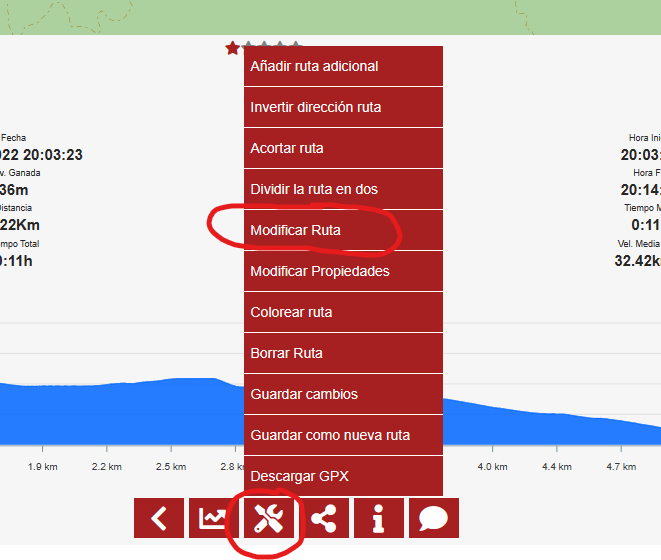 Then, as shown in the following image, we can see the available options:
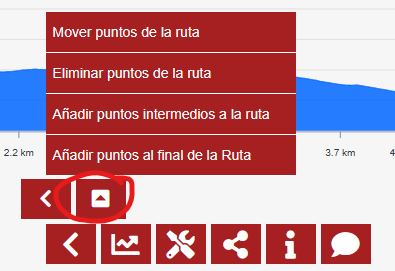
Adding points to the end of the route
When points are added to a route, because we are interested in expanding it, for example, we have two options:
Automatic : When we add a point with the "automatic" option, a passable path line will be drawn between the last point of the route and the one we have just added.
Manual : When we add a point with the "manual" option, a straight line will be drawn between the last point of the route and the one we just added.
We can alternate the use of the two methods, for example it may be the case that the information we use for the automatic layout is outdated and where before there was an obstacle (for example a fence, stone, etc.) that prevented the passage, This will cause the route to not be traced through that point in automatic mode, we can then activate manual mode, overcome that obstacle and later activate automatic mode again.
Adding waypoints
If we want to add points, but not at the end of the route, if not at an intermediate point, we will use the corresponding menu option, we will click on an intermediate area of the route where we want to add a point, and then we will click on the button " Add point".
Later, by activating the option to move points, we can move that point.
Removing points
If we want to remove a point: if the point we want to remove is a point that we have added with the option to add a point at the end of the route, we will simply press the undo button.
If the point that we want to delete is an intermediate point of the route, we will select from the menu (the one in the image above) the option to Delete Route Points, we will click on the route at the point that we want to delete, and then we will click on the delete point button.
Saving changes
When you finish modifying a route you can save the changes to it, be very careful because you won't be able to recover it after doing that. But you can also save the changes to a new activity or plan.
Weigner's Law or supercompensation
Weigner's Law or principle of supercompensation
When we do physical exercise or any type of continuous and repeated efforts over time, our body undergoes a series of adaptations that will produce an improvement in our strength and performance. It is the way in which you will prepare to face similar or greater efforts in the future while minimizing possible damage.
This process is not instantaneous, it requires a repair and regeneration time. When applying a stimulus, effort or workload we will suffer an initial decrease in our performance or effort capacity as a consequence of the tiredness and fatigue of our muscle fibers. After the rest, essential in any training plan, there will be a recovery process that will not only return us to the level of performance prior to the exercise, but will also increase it. If the effort is not repeated, the level of performance will drop again since our body will always tend to save energy.
Graphically we could represent it as follows:
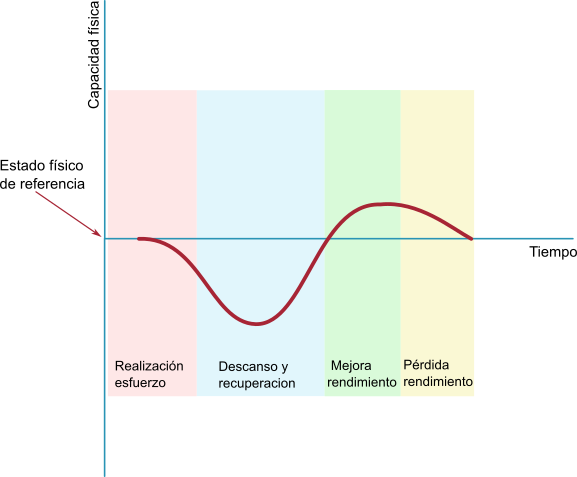
Obviously, a specific effort will not be enough for any improvement to take place and it will be necessary to repeat the efforts (training) so that the state of fitness acquired is not only not lost but also improved. In short, the accumulation of stimuli is necessary to achieve performance improvement.
The principle of supercompensation or Weigner's law shows us how our physical condition would evolve with the accumulation of training.
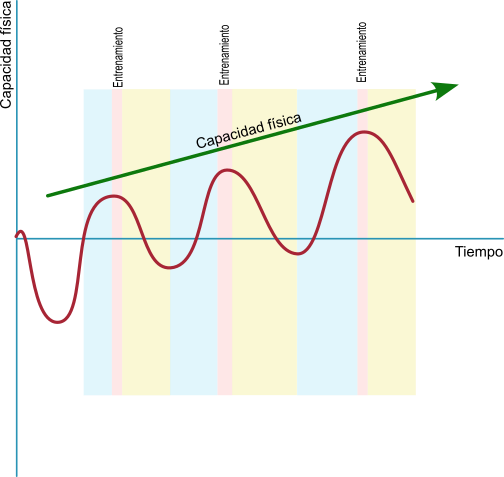
On the other hand, the training must increase its intensity and/or duration so that there is no stagnation of evolution.
Another obvious conclusion in view of the graph is that rest and correct recovery are essential to obtain the desired results, allowing the body to repair damaged tissues and the necessary physical and metabolic adaptations.
Curve and power profile in cycling
Curve and power profile in cycling
The power profile in cycling is a graphical representation of the average power values obtained by the athlete during certain periods of time making an effort.
By average power we understand the arithmetic mean of the power generated in a period of time and it will be obtained by dividing the watts of the entire session by the time spent. Normally it is a data that will automatically provide the potentiometer.
In general, certain certain or critical periods of time are used because they will provide information corresponding to different physical capacities that we will develop in another article, the most characteristic are:
Power in 5 seconds: indicates the capacity for maximum efforts or maximum anaerobic capacity.
Power in 1 minute: indicates the anaerobic capacity.
Power in 5 minutes: indicates the Maximum Aerobic Power (MAP) or maximum oxygen consumption (VO2max)
Power in 20 minutes: indicates the power in the vicinity of the anaerobic threshold
Power in 60 minutes: Also known as Functional Threshold Power or FTP. It is an indicator of the maximum power that we would be able to develop during a period of one hour.
Without going into describing the energy systems used by the body to supply energy to the muscles, we will limit ourselves to briefly describing some of the concepts mentioned:
Aerobic and anaerobic effort
We will call it an aerobic effort to that effort of prolonged duration in time and that is carried out at a moderate or low intensity and therefore sustainable. The circulatory system is capable of providing sufficient oxygen for energy-producing cellular chemical reactions.
On the other hand, an effort of an anaerobic nature is known as one that has a high intensity and that is carried out during a short period of time. Because this effort is very intense, the oxygen available to the cells is limited by exceeding the supply capacity of the circulatory system, so the energy production system in the cells will be different. These efforts will only be sustainable for short periods of time.
Maximum Oxygen Volume
VO2max is the "Maximum Oxygen Volume" and represents the maximum amount of oxygen in milliliters that a person consumes each minute and for each kilogram of body weight (ml/kg/min) and gives an idea of the efficiency with which our body uses the Oxigen. It is therefore a measure of our aerobic capacity and the resistance of our cardiovascular system. It is a value that has a great genetic dependency although its improvement is possible within certain limits.
Returning to the subject of the power curve, there is specific software for training that automatically provides this curve and there is also abundant literature about its interpretation, the methods for obtaining the data, etc. On this occasion we only want to expose what is the basis for the elaboration of the power profile in a manual and simple way so that you know its fundamentals.
It is necessary to point out that, in order to correctly compare the curves of different athletes, or your own over time, the correct thing would be to have the power data based on the individual's body weight since it is not the same to develop 300 watts weighing 50 kilos than developing 300 watts weighing 80 kilos, especially when it comes to ascents, in the case of the heaviest athlete, his ascent speed will be less for the same power developed. This power per kilo is obtained simply by dividing the absolute watts by the kilos of the athlete's weight.
Elaborating a cyclist's power profile
To create a power profile, it will be enough to obtain the average power developed in the different measurement time intervals.
Example: We will create a table with the average power values obtained in the different time intervals.
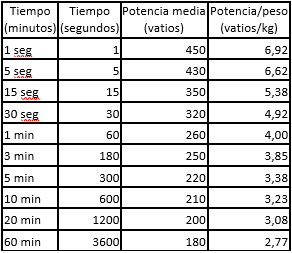
We will build the graph where on the x axis we will represent the time and on the y axis the power.
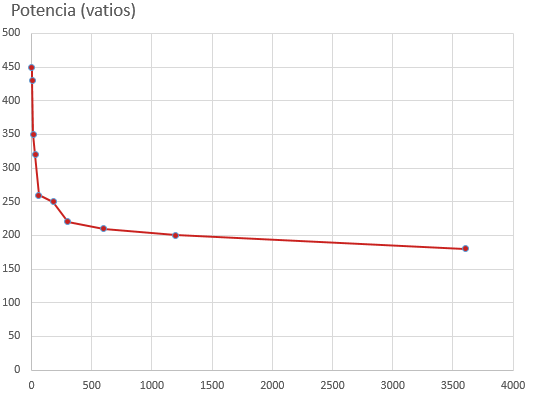
In order for the graph to show in a more detailed way the values for smaller time intervals, 1 second, 5 seconds... that are very stacked, it will be convenient to represent the x-axis on a logarithmic scale.
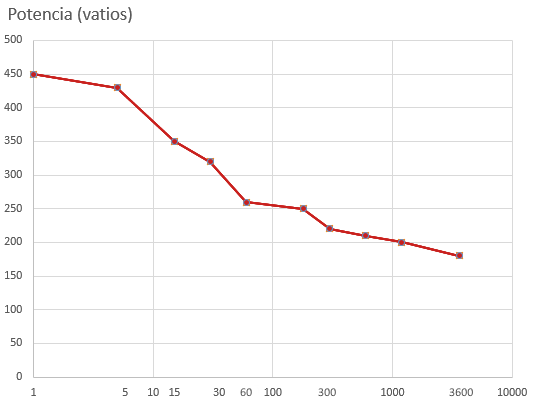
In another article we will make a more detailed analysis of the information provided by the power profile about the athlete's abilities and, above all, the areas where improvement is possible depending on their objectives.
BCD or bolt circle diameter of a bicycle chainring
BCD or bolt circle diameter of a bicycle chainring
BCD bicycle chainrings The BCD (Bolt Circle Diameter) or bolt circle diameter of a bicycle transmission chainring is the diameter of the imaginary circle that passes through the center of the bolt holes, provided they are arranged following a circular and equidistant pattern.
Common measurements in mountain biking are BCD 104 and BCD 94 and BCD 96 and they come with four or five holes.
When the chainring has four holes, getting your BCD is as simple as measuring the distance between the centers of two opposite holes.
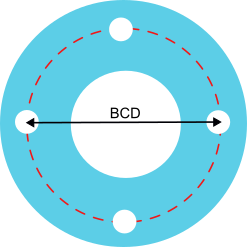
When the plate has five holes, the process will be somewhat more complicated, but not excessively. In this case we will take the measurement, in millimeters, of the distance between the centers of two adjacent holes and we will carry out the following calculation:
56 x distance-centers / 32.9.
For example, if the measurement is approximately 55 mm (it will be difficult to find the exact center of the hole), we will have: .
56 x 55 / 32.9 = 93.6 which we can round to 94, with which the BCD will be 94.
Mathematical foundations and calculation method for any distribution
For those who are curious about where the previous formula comes from and who also want to be able to calculate the BCD of any regular distribution and circular of screws, bolts or their holes, it is not necessary more than the application of basic trigonometry.
Knowing that the circumference has 360º, if the plate has 5 equidistant holes, the angle formed between any two of those holes will be the one that results from dividing 360 by 5, that is, 72º
Observing the following figure we see that we can obtain all the necessary elements for our calculation:
On the one hand we have the radius of the circumference, taken from the center of the disc to the center of the hole. We will use this segment as the hypotenuse of the right triangle.
On the other hand we have the angle alpha formed between two holes. The bisector of this angle (line that divides it into two equal parts) will define the contiguous leg of the right triangle and will form an angle with the hypotenuse of alpha / 2.
And finally, we see that the distance between the centers of the adjacent holes d is also divided by two by the bisector, so there we will have the opposite leg that we needed to complete our right triangle and its length will be d / 2.
With these data and knowing that, in a right triangle, the sine of the non-right angle is equal to the opposite leg divided by the hypotenuse, we can perform the calculations shown:
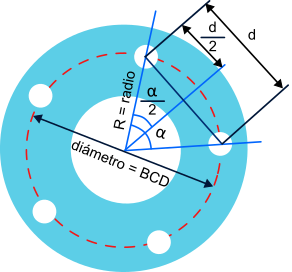
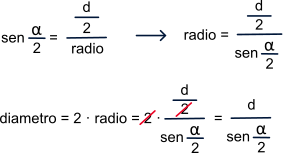
sin ( angle / 2 ) = ( distance-centers / 2) / radius.
radius = (distance-centers / 2) / sin ( angle / 2 ) .
diameter = 2 · radius .
diameter = 2 · radius = 2 · (distance-centres / 2) / sin ( angle / 2 ) = distance-centres / sin ( angle / 2 ).
If we assume that the measurement taken between centers has been 55 mm. we can substitute "distance-centers" for that measure:
Diameter (BCD) = 55 / sin (36º) = 55 / 0.5878 = 93.57 approx. 94.
The quick formula that we saw previously (56 x distance-centers / 32.9 ) is based on a proportional relationship derived from the smallest anchor sizes that are usually found in bicycle chainrings, which are those corresponding to BCD 56, and with distance between adjacent holes of 32.9, but if you look at the quotient 32.9 / 56 = 0.5878, which is precisely the sine of 36º.
In the event that there are six holes, the angle between them will be 60º (360º / 6 = 60º) so in our calculations for six holes we will use sin(30º) (60º / 2 = 30º), instead of the of 36º
and the BCD will be obtained from: BCD = distance-centers / sin(30)
Example of Animation of 3D Routes
Click on the following links to see the animations
3D - Benaojan - Estación de San Roque
3D - Arca - Sotogrande - Castellar y Vuelta
Any route that you upload to Sicami can be viewed animated in 3D.
It is very easy, enter the route, and press the 3D button
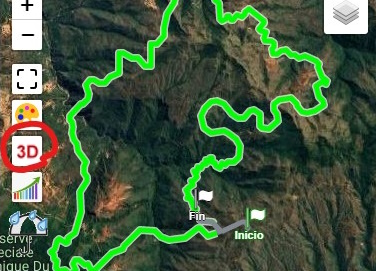
The following video shows how to share a 3D view of a route with whoever we want.
Comparative 3D Routes with more than one track / participant
Click on the following links to see the animations
3D - Comparison of the same users at different times 01
3D - Comparison 3 persons on the same route
Route of 2 participants on a very similar route 01
Any route that you upload to Sicami can be viewed animated in 3D.
It's very easy, enter one of the routes you want to compare, and press the 3D button

Add more routes to the 3D view. The routes must be in the same zone and have coincident sections.
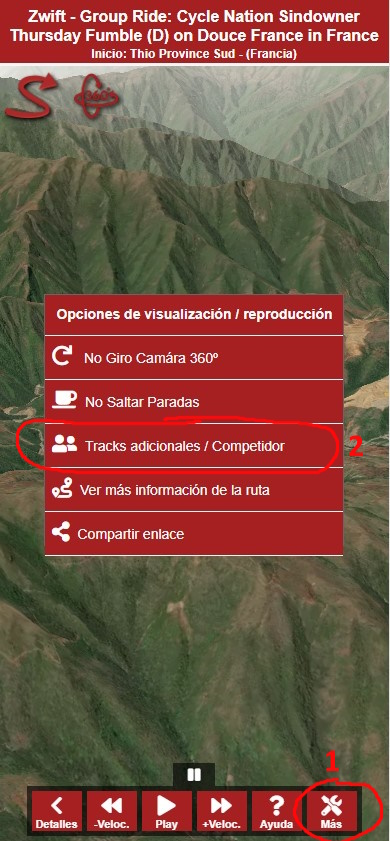
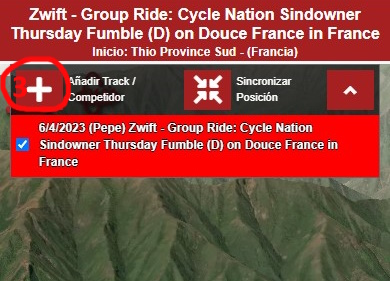
Once you have added the routes that you want to see, you must select a position through which all the routes pass, and that will be considered the starting point. This is necessary because each route will have been saved on different dates, and although they correspond to a departure at the same time by several users, each user could have a different time configured on their recording device, in this way we can synchronize the times. To do this you must press Play to see where each user passes and search for a matching position.
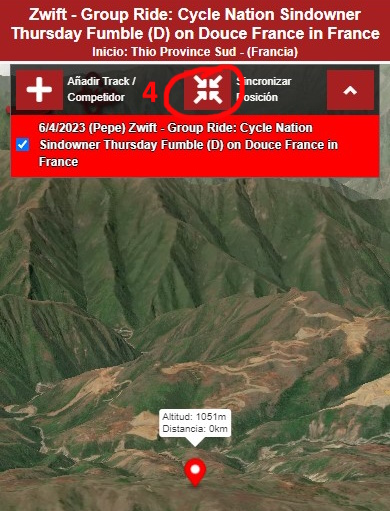
Once you have done all of the above you can press the Play button to start watching the animation.
The following video shows how to share a 3D view of a route with whoever we want.
Indications for responsible access to the rural and natural environment by cyclists and hikers. Rules for the safe coexistence of sports uses in the rural and natural environment.
Spanish Federation of Mountain Sports and Climbing and Royal Spanish Cycling Federation: Indications for responsible access to the rural and natural environment by cyclists and hikers
The Spanish Federation of Mountain and Climbing Sports and the Royal Spanish Cycling Federation, assuming the public responsibility entrusted to practitioners of their respective sports, propose the following code of responsible sports practice in rural and natural environments.
Regarding the inhabitant and the property
1) Park your vehicle in the areas established for this purpose. Leave access to homes, garages and fields clear. Do not make it difficult with your vehicle to pass through roads or trails.
2) For your activities, use public roads and other areas already designated for transit, without entering private property without permission.
3) Leave all the doors, gates, barriers, and other closure or access control elements as you found them, and do not alter them.
4) On your journey, refrain from picking fruits and other cultivated products, do not feed farm animals, do not interfere with the work of the inhabitants of rural areas, and take into account the indications they make.
5) Reduce the noise of your activity to a minimum.
Trash
6) Always carry a bag to collect the garbage that you produce during the activity and deposit it at one of the points where a collection service is provided. Biodegradable remains are also garbage, however much they may decompose in a few weeks or months. Take with you all the garbage that you generate and try to pick up something that you can find in your path.
Animals and cattle in the bush
7) Pass as far as possible from herds and other domestic livestock.
8) In the presence of wild animals, give notice of your presence in advance and avoid them. Do not disturb birds and other animals, especially when they are breeding. Before animals in an aggressive state, move away cautiously without sudden movements.
9) Find out before doing the activity about the restrictions on traffic for environmental reasons that may exist on the route, whether temporary or permanent.
10) Refrain from giving food to the animals you find.
Interaction with the environment
11) Interact with the natural environment in a respectful and discreet way, causing the least possible impact.
12) If in your activity you travel through an archaeological or paleontological site, or a geological enclave, do not take anything with you and communicate, if applicable, the location to the competent authority.
13) Avoid, in your activity, shortcuts and voluntary erosion of the land. Try not to travel off the trail or “cross country”.
14) If you notice the presence of a fire, notify the authorities.
15) If you find yourself on a road or path with unmarked wires, stones, or other unexpected and unpredictable elements that can obviously cause personal injury, take pictures, write down their geolocation, eliminate this dangerous situation, preserve the evidence in a safe place, and when you have the opportunity, inform the authorities.
16) Try not to leave a trace of your activity in the natural environment and do not take flowers, fruits, stones, etc.
17) Comply with current regulations, find out and follow the instructions of the authorities. If you come across areas that are temporarily closed, for whatever reason, look for an alternative.
Rules for the safe coexistence of sports uses in the rural and natural environment.
The Spanish Federation of Mountain Sports and Climbing and the Royal Spanish Cycling Federation, as responsible for the development of their respective sports, and for the responsibility they assume to ensure the safety of the users of the roads and trails and their coexistence in the rural and natural environment, propose the following scenario of coexistence both for their federated members and for the people who carry out these sports in Spain.
1. The coexistence of the sports uses of the two federations, on the same road in the natural and rural environment, is a growing phenomenon that requires education, common sense, coordination, collaboration, mutual understanding and generosity on the part of all.
2. People who use sports or leisure activities do not own the roads and trails, but are responsible for their preservation and good shared use.
3. Special attention will be paid to people with disabilities, people with reduced mobility, the elderly or young people. They will be given right-of-way when detected, possible and necessary.
4. Users must adapt their speed to their experience and physical conditions, to the safety conditions, characteristics, state and visibility of the road, to the speed limits established in the regulations, to the risk of coinciding with other users, to the weather and environmental conditions, and to any other circumstance that occurs at all times.
5. In case of overtaking, crossings, and especially dangerous maneuvers, the speed must be adapted to the circumstances of the moment and place. Respectfully mark and warn your hands open to other users and even if you have preference use prudence, be diligent and think about those who share the route or road.
6. All of us who use paths and trails for sport or leisure have the duty to be respectful of traditional uses. You must respect the priority of livestock transit and other rural uses.
7. When there is a signposted route, the priority of passage that has been specially established must be respected.
8. In the event that there is no established priority of passage on a route or road, the following rules are proposed for sports or leisure uses:
I In wide roads > 2.5 m
I.1. Given the perspective of a shared use of individual practitioners, they will travel as close as possible to the right side of the road, depending on their direction of progression.
I.2. In the case of crossing two or more groups of the same or different modes of mobility, each group must adapt the speed of transit to the circumstances and arrange themselves in single file and to their right according to their direction of progression.
I.3. In the event of having to overtake, the people who overtake will do so on the left side of the road depending on their direction of progression, they must reduce speed as much as necessary in advance and signal the maneuver audibly or verbally and respectfully, all this to carry out overtaking as safely as possible. The advanced person or groups will be arranged in single file and on their right.
II In the case of narrow roads < 2.5 m and especially in paths < 1 m
II.1.All people, regardless of their mode of mobility and direction of travel, must make their best efforts to facilitate crossing or overtaking manoeuvres.
II.2. In general, hiking traffic is established as a priority and cyclists in second place.
II.3. In the case of groups, the first and the last (depending on whether it is a crossing or an overtaking) of each one of them will verbally indicate the number of members of the same to the other, trying to group as much as possible to carry out the overtaking in the shortest time. possible.
III On descents, ascents or roads with difficulty
The right-of-way will be given, whenever possible, to users with less maneuverability, also taking into account the effort or difficulty for specific mobility in certain places. In the case of reduced visibility, precautions will be taken to guarantee the safety of users
Download original document: Acceso al Medio natural. Convivencia de usos RFEC y FEDME
About Sicami
At Sicami we intend to make easy-to-use tools available to everyone for viewing, managing and modifying routes (tracks).
We know that there are many other applications that already do this, but our intention is to make it as easy as possible for you.
Also little by little, thanks to the routes that our users upload and decide to make them public, we hope to be able to offer an extensive database of routes to do outdoors.
We would like our service to be free, but unfortunately the means to run our website are not free. We try to cover these costs with advertising that will be displayed on our website, we will try to make it not annoying and that it is appropriate for you, even that you get to thank it for finding interesting articles and services.
We want to be with you a great community of lovers of sports and outdoor activities.
My experiences with the cold and chilblains
Chilblains are an ailment that has attacked me since I was a child, and that will surely do so more harshly in old age. Known more popularly among my childhood friends as “blood sausage fingers”, an undeniable similarity of course, except for the black of the blood sausage and the red of the chilblain.
This affliction is characterized by inflammation, itching and, as I said, redness, and it usually comes hand in hand with the cold season. They also say, or so I've heard, that it's more common in women, damn my luck, that I belong to the other sex and still suffer from them, but genetics are capricious. In my particular case, I am always greeted with swelling of the middle finger of my right hand, spreading, if I don't take care of myself in time, through the rest of the fingers and even to the other hand (thus suggesting that I have better circulation in one than in the other hand). in the other). In theory, they can also appear on the feet (and even ears), but my bad luck does not reach that far, because it has never happened to me, a consequence, perhaps, of the fact that one always wears socks, but one does not always wear gloves . In this regard, I have to make the recommendation that I consider most effective against chilblains: gloves. As soon as I realized they were associated with cold and wet weather, I started wearing gloves more often and saw an almost instant improvement. Other "remedies" that I tried were counterproductive, such as bringing my hands closer to a fire or stove. This sudden change in temperature seemed, on some occasions, to make my chilblains worse. So my only advice to the poor man or woman who suffers from them like me is to get some good gloves that keep them warm. Other "remedies" that I tried were counterproductive, such as bringing my hands closer to a fire or stove. This sudden change in temperature seemed, on some occasions, to make my chilblains worse. So my only advice to the poor man or woman who suffers from them like me is to get some good gloves that keep them warm. Other "remedies" that I tried were counterproductive, such as bringing my hands closer to a fire or stove. This sudden change in temperature seemed, on some occasions, to make my chilblains worse. So my only advice to the poor man or woman who suffers from them like me is to get some good gloves that keep them warm.
Writing this about the gloves, I just realized an anecdote that may not be relevant, but I think it's worth attaching here for its humor.
I was buying gloves a few months ago in a store whose name I will not say when I stood next to a man who was also doing the same job as me, but with the particularity that he was looking for gloves that allowed the use, through tissue, touch screens; while I was more concerned with thermal protection (and price). Well, this good man, in order to make sure that the "touch" glove actually worked, he kindly grabbed the mannequin's hand, on which the glove was placed, and tried to interact with the mannequin's hand with the screen of his mobile, obtaining few results.
By breaking a spear in favor of man and not being smart, I have to admit something that I did not know prior to your Google search: today most of the mobile screens are capacitive, this is to say that the mobile is from contact by electrical conduction (yes, we have electrons in our fingers). Although it is true that, without a human hand in between, the screen probably does not know about the pulsation; depending on how the glove was made, the screen of your mobile could be unlocked, even with the hand of a mannequin.
I'm hot, and people laugh
-Luis de Gongora.
Types of maps that can be used in Oruxmaps
There is a wide variety of maps that can be used in applications such as Oruxmaps, which makes it difficult to classify the types of maps according to a single criterion, which is why we are going to present several possible classifications of maps.
We take this opportunity to leave this link to an article where there is some information about where to get maps for Oruxmpas: https://sicami.com/article/un-poco-de-todo/mapas-oruxmaps/edit
Classification 1 (Offline / Online)
Online Maps
These are maps that need an internet connection to use them. They have the advantage that they do not take up much storage space on our device.
-WMS Maps (Web Map Service)
-WMTS Maps (Web Map Tile Service)
Differences between WMS and WMTS
WMS: a service designed to obtain maps and layers in image format. WMTS: standard for serving and obtaining georeferenced map tiles over the network. WCS:
WMTS: delivers tiles (mainly with a size of 256x256 pixels), while WMS delivers one image per request.
The main difference between WMS and WMTS is the way the map data is delivered to the client. WMS delivers map data as a single image that is rendered in an ad hoc manner, while WMTS delivers map data as a set of tiles.
This can make WMTS more efficient at displaying large areas of the map, especially at high zoom levels, but it can also make it less flexible, as the available map scales and projections are limited to those that have been previously rendered as tiles.
Offline Maps
These are maps that do not require an internet connection to be used. They have the disadvantage that they tend to take up a lot of storage space on our device. In addition to that we will have to perform some kind of more or less manual process to load / use that map on our device.
Classification 2 (Raster / vector)
Raster maps
These are georeferenced bitmap images. That is, it is an image file that is assigned coordinates so that it is displayed in the correct location when opened with an application.
Raster files are characterised by the existence of a grid of cells or grids, more commonly known as pixels, in which each grid or pixel has a spatial quality or property (colour, altitude, etc.).
Vector maps
Geographic features are represented by three basic structures: points, lines and polygons. For example, a line representing a street may contain information about its name, colour, or type of terrain.
Vector maps / files usually take up considerably less space than raster maps / files, but raster models represent reality better and are often more effective for three-dimensional representations.
Classification 3 (Topographic / Orthophoto / Road / Hybrid)
Topographic
Map that represents the terrain, usually by means of contour lines, and can include all kinds of useful information about the area (roads, peaks, springs...). They are the most suitable maps for outdoor activities such as hiking or mountain biking. They can be raster or vectorial.
Orthophoto
Aerial image of the terrain, without added information. They are raster maps.
Roads
Map that includes specific information about roads and is especially suitable for urban navigation. In general these are vector maps. TomTom maps are the best example. TwoNav's OSM maps could also fall into this category, although they can also be considered topographic and the road information is not as optimised as in TomTom.
Hybrids
These are usually maps that combine the image of the terrain with information on city names, roads, etc.
In the following link we provide you with information on where to get maps and other resources for Oruxmpas:
https://sicami.com/article/recursos-oruxmaps/mapas-oruxmaps
Elevation and slope calculation
Elevation and slope calculation. Accumulated positive slope and accumulated negative slope. GPS altimeters, barometric altimeters and DEM Digital Elevation Model
Surely, during an outing or after doing it, when we have that appreciated coffee or beer with colleagues, you have experienced this conversation: "I have 456m of slope..." "well, they give me 537...", "what wow man!!!, yes it's 425!!!".
Well yes, with obtaining the altitude, necessary to calculate the accumulated difference, there are always controversies and differences.
In this section we will try to explain the different methods that are normally used, both to obtain the altitude and other parameters related to hiking, biking, etc.
But before continuing, it is worth reviewing the three main systems used to determine the altitude of a point, these are: GPS altimeters, barometric altimeters and the DEM Digital Elevation Model.
We also recommend you take a look at the article "Altitude, Height and Elevation" in the "Additional information, curiosities and glossary of terms" section of this site
We also leave a link to this interesting blog article "Explorando Oruxmaps" in which the different methods in which the application is discussed and explained Oruxmaps shows the altitude and performs the calculation of the accumulated slopes:
https://tronpoonpo.blogspot.com/2023/01/algoritmo-de-elevacion.html
GPS receivers, GPS watches, and cycle computers commonly use two methods to measure altitude: GPS altitude measurement and barometric altimeters.
GPS altimeters
The most basic range devices use GPS altitude measurement. This consists of obtaining the altitude data by performing calculations based on the position of the receiver in the horizontal and vertical planes. In the horizontal plane, GPS precision is quite high, but not so much in the vertical plane, due to the different relative position of the satellites with respect to the GPS receiver (see the article “Global Positioning System” in the section “Additional information, curiosities and glossary of terms” of this site). Another problem that can arise is the lack of data due to loss of GPS coverage.
Barométric altimeters
Slightly higher-end devices usually have barometric altimeters for altitude measurement. Barometric altimeters are much more reliable than those measured by GPS and their operation is based on measuring the atmospheric pressure at the current position, which will be lower as the height increases, since it depends on the weight of the existing air column just below. over. The density of air and its pressure vary logarithmically with height, reducing approximately in half at 5000 meters, where it is approximately half an atmosphere, that is, half the pressure at sea level, which is one atmosphere.
The accuracy of the measurement of a barometric altimeter depends mainly on two factors, the first is the correct calibration at the starting point of the activity and the second, that the measurement may be affected by changes in atmospheric pressure that may cause changes in the weather. A drop in atmospheric pressure caused by a storm will be interpreted by the barometer as an increase in height. Other factors such as dirt clogging the sensor port may also affect it.
Digital Elevation Model (DEM)
The cartography supported by satellite measurements, has allowed to elaborate topographic maps with a high precision in the altitude data in each point of the terrain. Having a GPS receiver with DEM data mapping will allow you to accurately calculate the altitude of your location. The DEM is a raster, raster, or array of cells, each cell representing a unit of square area and containing a measured or estimated numerical altitude value that corresponds to that location. It can be included next to the map or be external. The precision of this system is limited on the one hand by the reliability of the DEM itself and on the other hand by the resolution of the mesh used. In maps, it is common to use DEM 200x200 meters, since higher resolutions (DEM 25x25 m, DEM 5x5 m) imply a greater amount of information and therefore a greater workload for the device, as well as greater requirements in terms of internal storage capacity.
It is possible to apply corrections to the altitude recorded by a GPS receiver using the DEM Digital Elevation Model. It is the usual method used by different platforms. In the case of Strava, instead of using DEM data, it uses data from the activities it has registered, obtaining an average of the altitude measurements of each of them. Every activity uploaded to the platform from a barometric altimeter device is used to develop the Strava elevation reference map.
Below is an example of how DEM resolution can affect elevation profile estimation.
In this first case we have traced a route using a DEM with a resolution of 10x10 m.

In this second case, the same route is shown on a DEM with a resolution of 30x30 m.
